Singapore Airlines Share Price Falls 1.14% on Friday, Testing Key Resistance
Technical analysis of Singapore Airlines stock on November 6, 2026: price 6.95 SGD, trend sideways, RSI 65.2, support 6.49, resistance 7.03.

Trend & Price Action
The shares closed above their 20-day moving average of S$6.66, while that average rose 0.97% over five days. The 20-day and 50-day averages both stand at S$6.66, and no new moving-average crossover has formed. That combination points to a market recovering within a sideways structure, rather than a confirmed longer-term shift in direction. The stock sits at 85% of its 20-day range, between support at S$6.49 and resistance at S$7.03. It is also close to the upper Bollinger Band at S$6.96, with the band’s position reading at 99%. Bollinger Bands map how far a price has moved relative to its recent average; a reading near the upper edge signals strength, but can also mean the stock is pressing against a short-term ceiling. The band width is 9.1%, described as normal—not an unusually tight setup that would suggest volatility has been compressed.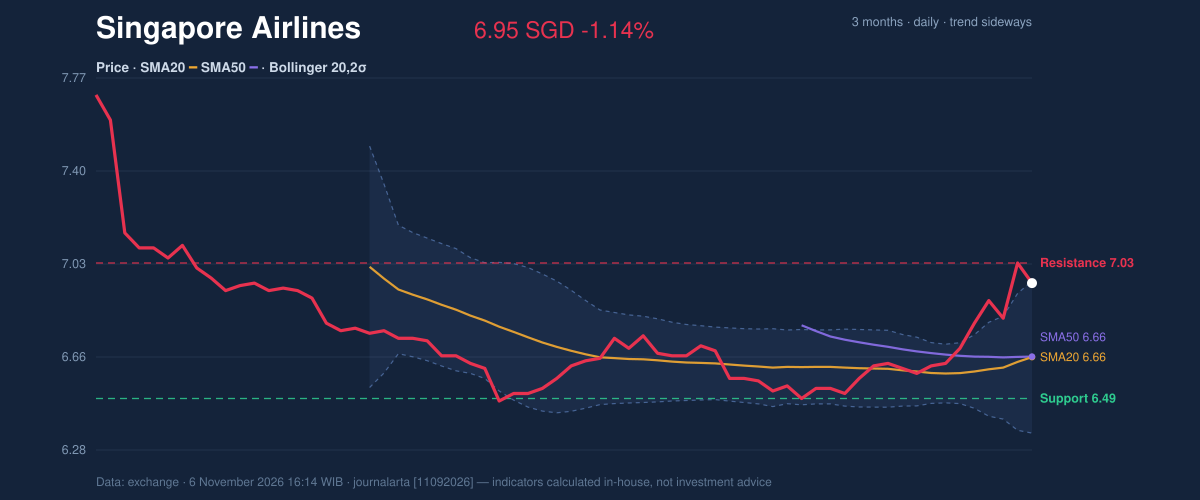
Oscillators & Momentum
Momentum indicators are positive but not uniformly strong. The MACD, a measure of the relationship between shorter- and longer-term price momentum, is 0.065 against a signal line of 0.015, leaving a positive histogram of 0.050. This supports the recent advance, though it does not override the neutral overall bias. RSI is 65.2 and classified as neutral, while the Stochastic readings are %K 73.1 and %D 78.1, also neutral. RSI gauges the speed of price moves; Stochastic compares the latest close with the stock’s recent trading range. Both are elevated enough to show recent strength, but neither is classified in the supplied data as an extreme. Stochastic %K is below %D, a reason to be cautious about treating the latest move as a clean acceleration.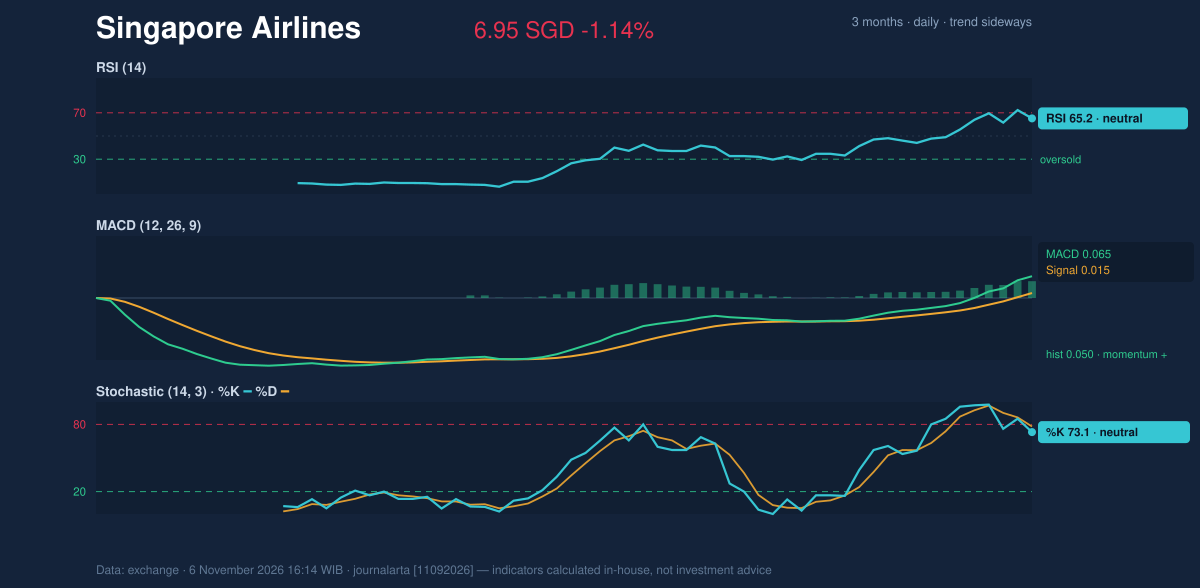
Volatility & Volume
Volume of 7,681,900 shares was 1.6 times the 20-day average of 4,710,981. Rising OBV—the running total of volume adjusted for whether prices rise or fall—suggests buying participation has accumulated over the period. But heavier turnover on a day when the stock fell is not, by itself, confirmation that demand is strong enough to clear resistance. ATR is S$0.12, or 1.7% of the share price, indicating moderate volatility. In practical terms, ordinary daily swings remain meaningful when the share price is near a chart boundary. The upper Bollinger reading and resistance at S$7.03 make the next test clear: a sustained move above that level would strengthen the case that momentum is extending, while failure to hold above the moving averages would weaken it.Key Levels & Scenarios
The immediate reference points are S$7.03 resistance and S$6.49 support. A move through resistance would bring the three-month high of S$7.72 into view as the next longer-term reference, but the data do not establish that such a breakout has occurred. On the downside, a fall through support would put the three-month low of S$6.46 close by. The supplied ATR-based reference levels are S$6.77 below and S$7.13 above the last price. They offer a measure of possible movement, not a forecast. For now, the stock’s location near the top of its short-term range is balanced by positive MACD and rising OBV, leaving neither side with a clear technical advantage.Technical Verdict: HOLD (wait & see)
The data’s technical bias is neutral, with no bullish or bearish signals among the seven measures counted on either side. The verdict rests on three features: price remains above the S$6.66 moving averages, MACD momentum is positive, and the share price is near S$7.03 resistance with a 99% Bollinger %B reading. A failure to hold below S$6.49 support would invalidate this neutral reading by breaking the stated 20-day support.- Ideal entry range: S$6.49–S$6.66, spanning 20-day support and the moving averages.
- Exit target: S$7.03, the 20-day resistance.
- Stop-loss protection: S$6.35, the lower Bollinger Band.
Data
Singapore Airlines (C6L.SI), Singapore Exchange; session: Friday, November 6, 2026. Last price: S$6.95; previous close: S$7.03. Change: one day −1.14%, five days +3.89%, one month +5.78%. Trend: sideways; 20-day average slope: +0.97% over five days. SMA20: S$6.66; SMA50: S$6.66; no new crossover. Bollinger Bands: upper S$6.96, middle S$6.66, lower S$6.35; %B 99%; width 9.1% (normal). RSI(14): 65.2 (neutral). Stochastic: %K 73.1, %D 78.1 (neutral). MACD: 0.065; signal 0.015; histogram 0.050. ATR(14): S$0.12 (1.7%). Volume: 7,681,900; 20-day average: 4,710,981; OBV rising. 20-day support/resistance: S$6.49/S$7.03. Three-month high/low: S$7.72/S$6.46. Technical bias: neutral. JournalArta had not covered the stock in the previous 14 days.
Why Singapore Airlines is in focus today
- Volume at 1.6× the 20-day average
- Not covered by JournalArta in the last 14 days
Selected automatically from 32 SGX (Singapore) stocks by a technical-signal score with daily weighted randomisation — not a recommendation.
Summary Data Singapore Airlines
| Last price | 6.95 SGD |
| Change 1 day / 5 days / 1 month | -1.14% / 3.89% / 5.78% |
| Trend / MA-cross | sideways / none |
| SMA20 / SMA50 | 6.66 / 6.66 |
| RSI (14) / Stochastic %K | 65.2 / 73.1 |
| Bollinger %B / ATR | 99% / 0.12 |
| Support / Resistance 20 days | 6.49 / 7.03 |
| Data as of | 6 November 2026 16:14 WIB |
Disclaimer: This technical analysis is generated automatically from exchange data and indicators calculated by JournalArta, for information and education only. The verdict and the entry, target and stop-loss levels are not investment advice or a solicitation to buy or sell any security. Investment decisions and their risks rest solely with the reader.
Track Singapore Airlines share price daily: live levels, support/resistance and our full Singapore Airlines analysis history.