Starbucks (SBUX) Stock Technicals: Falls 0.71% on Friday, Golden Cross Formed
Technical analysis of SBUX stock on November 6, 2026: price 105.41 USD, trend uptrend, RSI 60.1, support 92.00, resistance 109.70.
By Elena Vance
November 9, 20264 min read
Advertisement
Logo Starbucks — JournalArta illustration
Why SBUX is in focus today
Fresh golden cross: SMA20 crossed above SMA50
Uptrend confirmed (5-day change 1.68%)
Not covered by JournalArta in the last 14 days
Selected automatically from 100 NASDAQ (US) stocks by a technical-signal score with daily weighted randomisation — not a recommendation.
Starbucks shares slipped 0.71% to $105.41 on the Nasdaq on Friday, November 6, 2026, even as a closely watched trend signal flipped positive. The 20-day moving average crossed above the 50-day average two sessions before that close, a pattern known as a golden cross.
It was a quiet pullback. The stock is still up 1.68% over five days and 16.15% over one month, and the pattern says buyers have kept control of the medium-term trend.
Trend & Price Action
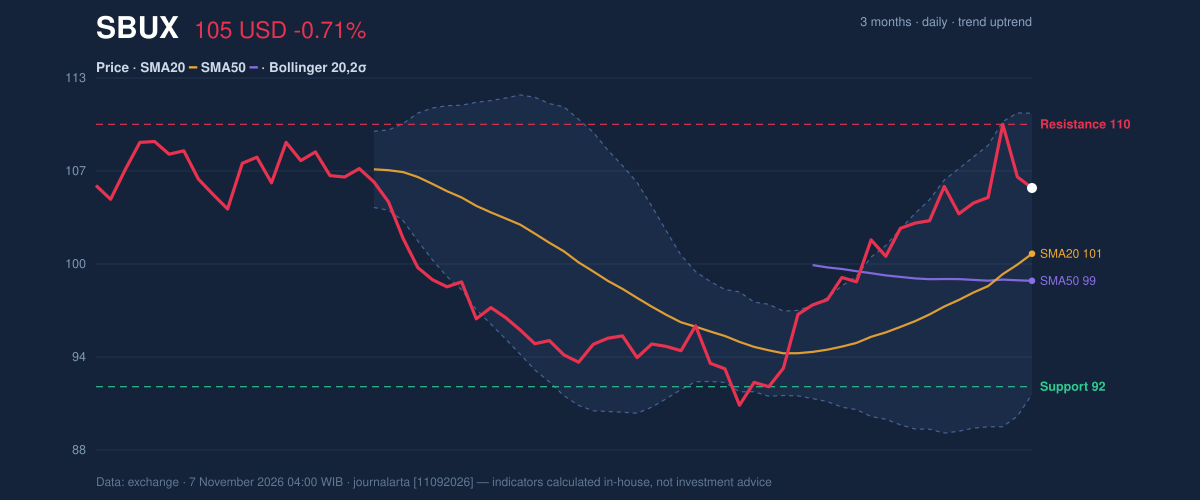
The price sits above both averages: the 20-day at 100.98 and the 50-day at 99.15. The gap between the two is narrow, which is typical of a fresh crossover. The 20-day average rose 3.19% over five days, so the short-term trend is steepening, not just crossing.
Why it matters: a golden cross confirms that recent prices are running above the longer-term norm. It lags the price, so it rarely marks the exact bottom of a move. It does show that the rally has lasted long enough to lift the averages.
The stock trades at 76% of its 20-day range, between support at 92.00 and resistance at 109.70. The three-month high is 111.50 and the low is 87.35, so the shares sit in the upper part of a wide band, as the chart shows.
3-month price action chart of SBUX: price, SMA20/50, Bollinger, support & resistance.
Advertisement
Oscillators & Momentum
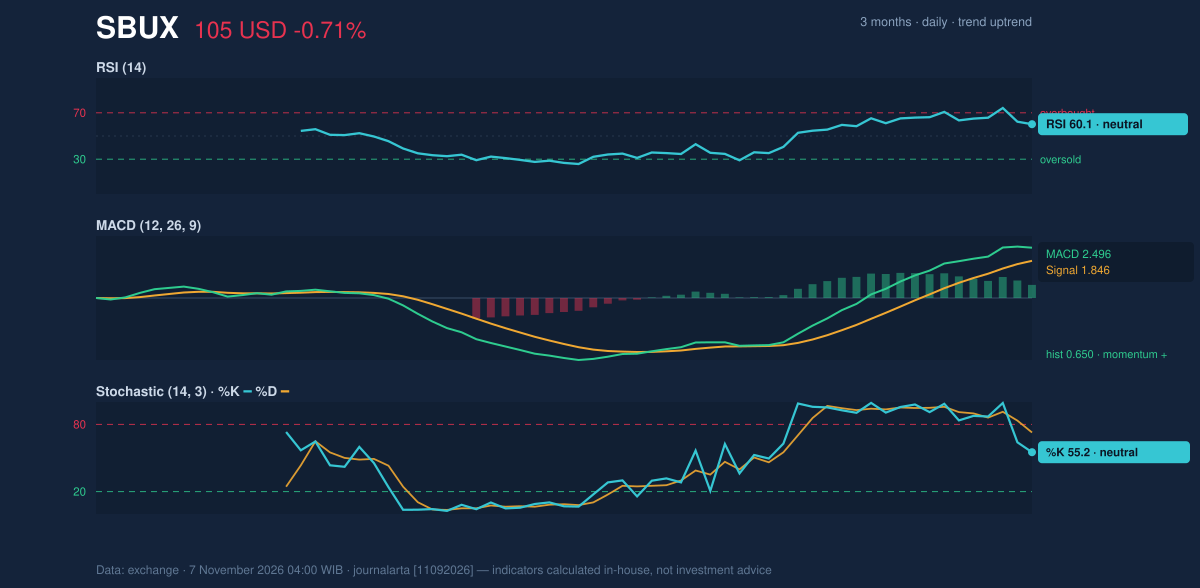
Momentum is positive but not stretched. The 14-day RSI reads 60.1, neutral and well below the 70 level often treated as overbought. Code-based screening flags one bearish signal, that the RSI is rolling over from above 65. That points to some cooling after the one-month run, not a reversal.
The Stochastic oscillator shows the same easing. Its %K line is at 55.2, below the %D line at 72.8. When the faster line drops under the slower one, short-term buying pressure is fading, even if the broader trend holds.
The MACD, which compares short- and long-term price averages, supports the uptrend. It stands at 2.496 against a signal line of 1.846, leaving a histogram of 0.650. A positive histogram means the gap between the lines still favors buyers.
Momentum chart of SBUX: RSI(14), MACD, Stochastic.
Volatility & Volume
The Bollinger Bands, a range drawn two standard deviations around the 20-day average, run from 91.49 to 110.46. The band width is 18.8%, which is normal, and the %B reading of 73% puts the price in the upper half of the channel without touching the top edge.
The 14-day average true range (ATR), a gauge of typical daily movement, is 2.97, or 2.8% of the price. That is moderate volatility. A swing of roughly $3 in a session would be ordinary, not a signal.
Volume was 7,780,600 shares, about 0.9 times the 20-day average of 9,098,055. Friday's dip came on lighter-than-normal trading, which suggests sellers were not pressing hard. On-balance volume, which tallies volume on up and down days, is still rising. That fits an uptrend backed by steady participation.
Advertisement
Fundamental Context
According to its SEC filing, Starbucks reported quarterly revenue of $9.32 billion for the quarter ended June 28, 2026, down 1.4% from $9.46 billion a year earlier (Form 10-Q filed July 29). Net income was $1.05 billion, against $558.3 million in the prior-year quarter, with diluted earnings per share of $0.91. Profit has improved even as sales dipped. On October 29, the company filed a Form 8-K with the SEC reporting its results of operations and financial condition.
Key Levels & Scenarios
Resistance at 109.70 is the first hurdle, and the three-month high of 111.50 sits just above it. A close above 109.70 would open the way toward 111.50. Failure to clear it would leave the stock in its recent range.
On the downside, the 20-day average at 100.98 is the first support to watch. It lines up with the price minus 1.5 times the ATR, which is 100.96. A close below that zone would call the pullback-in-an-uptrend reading into question, and 92.00 would then be the next marker.
Technical Verdict: BUY
The code-based bias is BULLISH, with three of seven bullish signals against one bearish. The verdict is BUY, on technical grounds only.
Strongest reasons:
Golden cross: the 20-day average crossed above the 50-day two sessions before the latest session, and the 20-day average rose 3.19% over five days.
Momentum: the MACD histogram is positive at 0.650 and the RSI at 60.1 leaves room before overbought territory.
Participation: on-balance volume is rising, and Friday's decline came on volume at 0.9 times the average.
Advertisement
The verdict is invalidated if the price closes below 100.96, the lower edge of the entry zone.
Entry range: 100.96 to 105.41, from the ATR-based level and the 20-day average up to the last price.
Exit target (target price): 109.70, the 20-day resistance; 111.50, the three-month high, if that level is cleared.
Stop loss: below 100.96, which is price minus 1.5 times the ATR.
This is technical analysis, not investment advice. In plain terms, the chart favors the uptrend continuing while the stock holds above roughly $101, with $109.70 as the next ceiling.
Summary Data SBUX
Last price
105.41 USD
Change 1 day / 5 days / 1 month
-0.71% / 1.68% / 16.15%
Trend / MA-cross
uptrend / golden
SMA20 / SMA50
100.98 / 99.15
RSI (14) / Stochastic %K
60.1 / 55.2
Bollinger %B / ATR
73% / 2.97
Support / Resistance 20 days
92.00 / 109.70
Data as of
7 November 2026 04:00 WIB
Disclaimer: This technical analysis is generated automatically from exchange data and indicators calculated by JournalArta, for information and education only. The verdict and the entry, target and stop-loss levels are not investment advice or a solicitation to buy or sell any security. Investment decisions and their risks rest solely with the reader.