Technical analysis of MCHP stock on November 6, 2026: price 58.35 USD, trend downtrend, RSI 26.6, support 58.35, resistance 81.12.
By Alistair Sterling
November 9, 20265 min read
Advertisement
Logo Microchip Technology — JournalArta illustration
Why MCHP is in focus today
One-day move of -10.02%, about 1.2× its average daily range (ATR)
Volume at 3.1× the 20-day average
Fresh death cross: SMA20 crossed below SMA50
RSI(14) at 26.6 — oversold zone
Downtrend extending (5-day change -24.55%)
Not covered by JournalArta in the last 14 days
Selected automatically from 100 NASDAQ (US) stocks by a technical-signal score with daily weighted randomisation — not a recommendation.
Microchip Technology shares fell 10.02% to $58.35 in the Friday, November 6, 2026 session on NASDAQ, from a prior close of $64.85, according to exchange data. The drop came a day after the chipmaker filed its quarterly report with the U.S. Securities and Exchange Commission. It was heavy, and it had company. Volume reached 47,393,300 shares, 3.1 times the 20-day average of 15,212,030, and the stock is down 24.55% over five days and 22.77% over one month.
Trend & Price Action
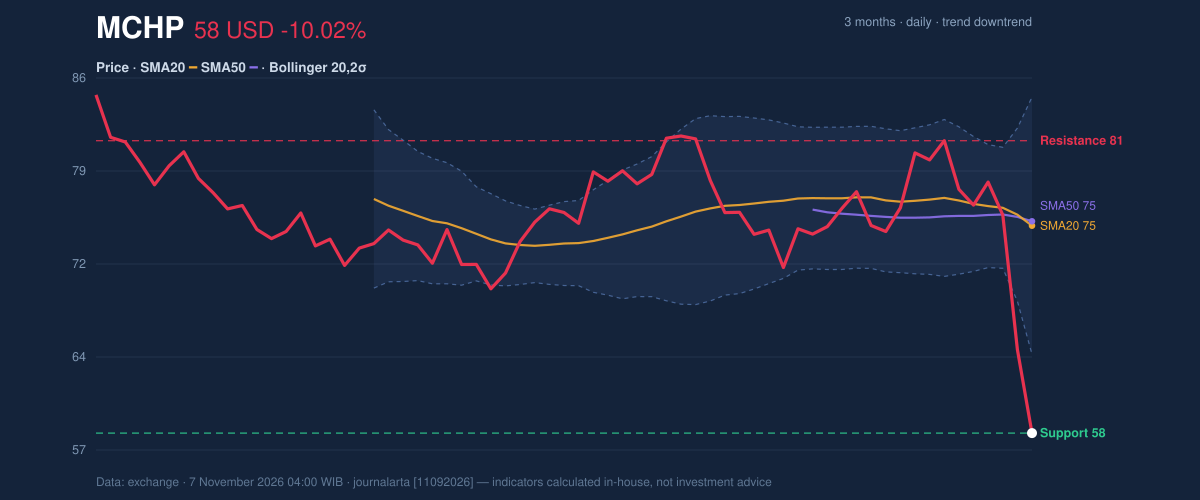
The slide has pushed Microchip below both of its key moving averages. The 20-day simple moving average, which smooths the last 20 sessions of closing prices, sits at 74.50. The 50-day average is at 74.85. With the price well under both, buyers who bought across the past month are sitting on losses, which tends to turn rallies into selling opportunities.
The more telling signal is a death cross on the latest session, in which the 20-day average slid below the 50-day. It is a lagging signal: it confirms what the price has already done rather than predicting what comes next. The 20-day average itself fell 2.57% over five days, showing the decline is not a single-day event.
3-month price action chart of MCHP: price, SMA20/50, Bollinger, support & resistance.
Advertisement
As the chart shows, the close landed exactly on the 20-day support of 58.35, leaving the stock at 0% of its 20-day range. Resistance for that window is 81.12, and the three-month range runs from a low of 54.83 to a high of 85.97. In plain terms, the stock has traveled almost the full distance from the top of its recent range to the bottom in a few weeks.
Oscillators & Momentum
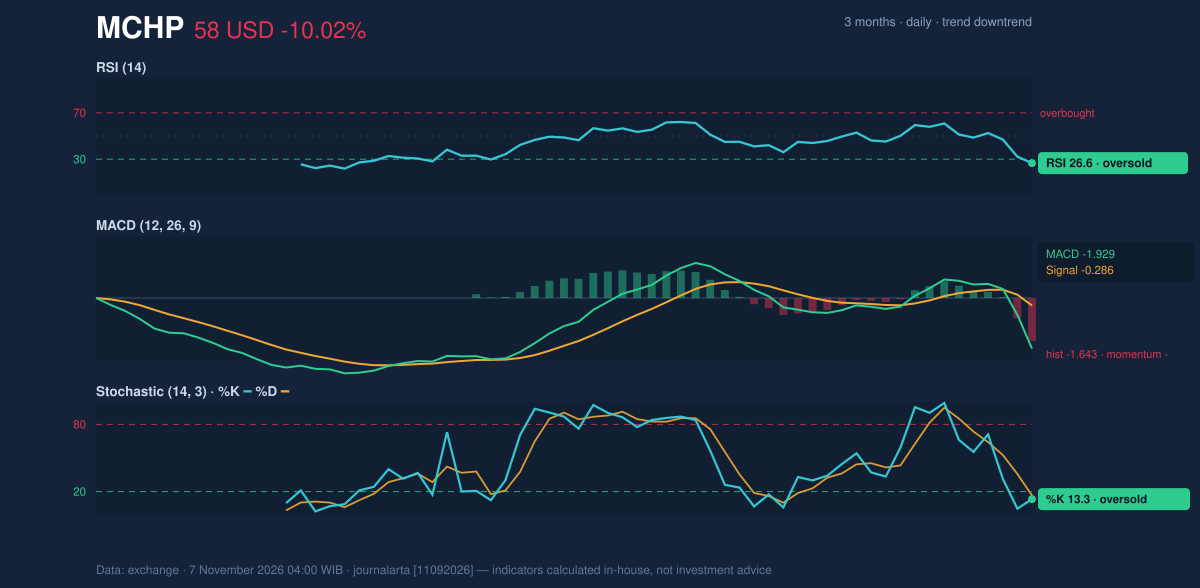
Momentum gauges agree with the price. The 14-day Relative Strength Index (RSI), which measures how fast gains compare with losses, reads 26.6. That is in oversold territory, which means selling has been unusually one-sided. The Stochastic oscillator, which compares the close with the recent trading range, shows %K at 13.3 and %D at 16.5, also oversold.
Oversold does not mean "about to rise." In a strong downtrend, such readings can persist as prices keep sliding. What matters is whether they are joined by a turn in the other indicators, and so far they are not. The MACD line is at -1.929 against a signal line of -0.286, leaving a histogram of -1.643, a sign that downside momentum is still building rather than fading.
Momentum chart of MCHP: RSI(14), MACD, Stochastic.
Advertisement
Volatility & Volume
Bollinger Bands, which mark two standard deviations around the 20-day average, show the price well outside the normal range. The lower band is at 64.49, the middle at 74.50 and the upper at 84.52. The %B reading of -31% means the close sits below the lower band. Band width has expanded to 26.9%, a sign of high volatility.
The Average True Range (ATR), a measure of typical daily movement, is 4.74, or 8.1% of the price. Wide daily swings like this make both sharp relief rallies and further drops plausible.
Volume adds weight to the move. A close below the 20-day low on 3.1 times normal turnover suggests the selling was broad rather than thin. On-balance volume (OBV), which tallies volume on up days against down days, is falling, a sign that participation is confirming the decline.
Fundamental Context
The price reaction contrasts with the company's reported numbers. According to its SEC filing, Microchip reported quarterly revenue of $1.62 billion for the quarter ended September 30, 2026, up 42.2% from $1.14 billion a year earlier (Form 10-Q filed November 5). Net income was $401.4 million, against $41.7 million a year earlier, with diluted earnings per share of $0.68. The filings alone do not explain why the stock fell as it did. The technical picture is driven by how the market is pricing the shares, not by the reported figures.
Advertisement
Key Levels & Scenarios
The nearest floor is the 3-month low of 54.83. A move below it would open the way toward 51.24, which is the price minus 1.5 times the ATR. On the upside, a rebound would first meet the lower Bollinger Band at 64.49, then 65.46, the price plus 1.5 times the ATR. A recovery toward the 20-day average at 74.50 would be needed to challenge the bearish structure.
Technical Verdict: SELL
The computed technical bias is bearish, with four of seven bearish signals active and none of the seven bullish ones. The verdict is SELL, drawn from these indicators:
- Death cross: the 20-day average crossed below the 50-day on the latest session.
- Volume and structure: the close fell below the 20-day low on 3.1 times average volume, and falling OBV confirms the trend.
- MACD: the histogram at -1.643 shows negative momentum still expanding, even with RSI at 26.6 and Stochastic at 13.3 in oversold territory.
Levels, taken only from the data:
- Ideal entry range: 58.35 to 64.49 (current close to the lower Bollinger Band)
- Exit target (target price): 54.83 (3-month low); an extended move would reach 51.24
- Stop loss: 65.46 (price plus 1.5 times the ATR)
The verdict is invalidated if the price recovers above 65.46. This is technical analysis, not an investment recommendation.
In plain terms, the chart shows sellers firmly in control, and strong quarterly results have not yet changed that.
Advertisement
Summary Data MCHP
Last price
58.35 USD
Change 1 day / 5 days / 1 month
-10.02% / -24.55% / -22.77%
Trend / MA-cross
downtrend / death
SMA20 / SMA50
74.50 / 74.85
RSI (14) / Stochastic %K
26.6 / 13.3
Bollinger %B / ATR
-31% / 4.74
Support / Resistance 20 days
58.35 / 81.12
Data as of
7 November 2026 04:00 WIB
Disclaimer: This technical analysis is generated automatically from exchange data and indicators calculated by JournalArta, for information and education only. The verdict and the entry, target and stop-loss levels are not investment advice or a solicitation to buy or sell any security. Investment decisions and their risks rest solely with the reader.