Technical analysis of GOOGL stock on November 6, 2026: price 284.78 USD, trend downtrend, RSI 29.7, support 278.99, resistance 353.78.
By Alistair Sterling
November 9, 20265 min read
Advertisement
Logo Alphabet (Google) — JournalArta illustration
Why GOOGL is in focus today
RSI(14) at 29.7 — oversold zone
Selected automatically from 100 NASDAQ (US) stocks by a technical-signal score with daily weighted randomisation — not a recommendation.
Alphabet shares are down 19.02% over the past month, and for global investors who treat the stock as a bellwether for AI-era tech spending, the key question is whether selling has run its course. The Nasdaq-listed stock closed Friday, November 6, 2026, at $284.78, up 0.78% on the day and 1.77% over five sessions. RSI sits in oversold territory, which is why the stock was flagged for review.
One bounce does not make a base. Here is what the signals say.
Trend & Price Action
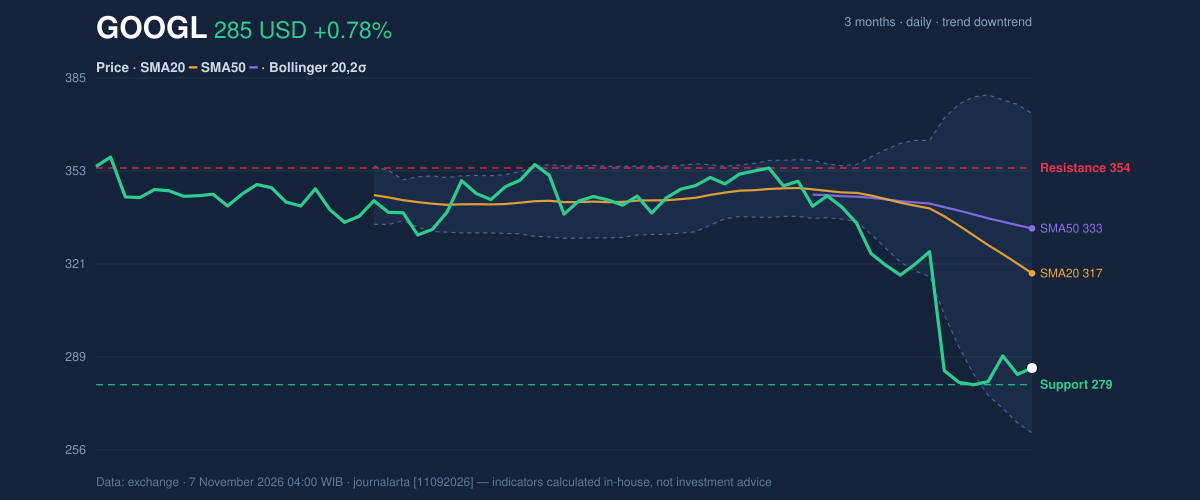
The trend is still down. Price trades below the 20-day average at 317.44 and the 50-day average at 332.93, so both major averages sit above the market and act as ceilings. The 20-day average itself fell 4.93% over five days, showing the damage is still working through the data. No new moving-average crossover has formed.
The stock sits near the bottom of its range. Its 20-day support is 278.99, and the three-month low is 276.92, just below that. The 20-day resistance is 353.78 and the three-month high is 364.17. At 8% of its 20-day range, the price is hugging the floor.
3-month price action chart of GOOGL: price, SMA20/50, Bollinger, support & resistance.
Advertisement
As the chart shows, price sits just above the 20-day support, with the averages sloping down overhead. Support and the three-month low are only about two dollars apart, so they form a tight zone. That zone has not broken yet. It is still the line to watch.
Oscillators & Momentum
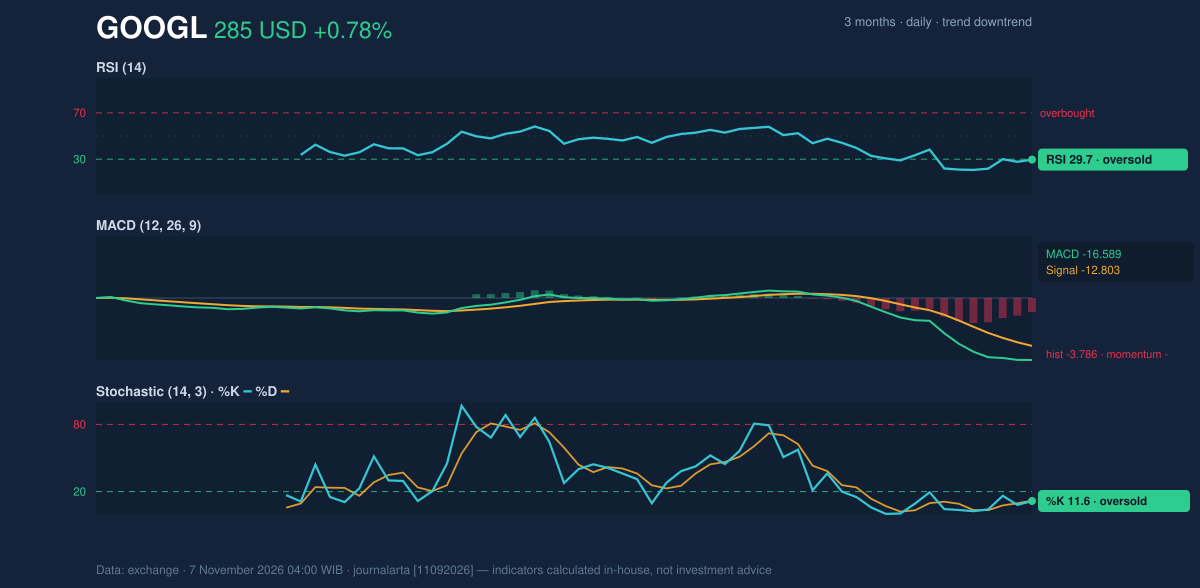
Oscillators measure how stretched a move is. RSI(14) is 29.7, below the 30 line that marks oversold conditions. The Stochastic reads 11.6 (%K) and 12.0 (%D), also deeply oversold. Both say selling has been heavy and sellers may be tiring.
But they are not buy signals. In a downtrend, oversold readings can persist for weeks.
The MACD, which tracks the gap between short- and long-term momentum, still points the wrong way. It reads -16.589 against a signal line of -12.803, with a histogram of -3.786. Momentum is negative, and the gap has not narrowed.
Momentum chart of GOOGL: RSI(14), MACD, Stochastic.
The chart shows the split: oscillators are scraping the floor while MACD has not turned. When these disagree, the market is usually waiting for confirmation.
Advertisement
Volatility & Volume
Bollinger Bands (a channel drawn two standard deviations around the 20-day average) have widened to 34.7% of the middle line. That signals high volatility. Price is at 20% of the band's width (%B), between the lower band at 262.31 and the middle at 317.44. The upper band is 372.57.
The ATR (average daily trading range) is 11.30, or 4.0% of the price. A typical day can move the stock by roughly that much in either direction. That calls for wide margins on any scenario.
Volume tells a cautious story. Friday's 36,283,900 shares were 0.9 times the 20-day average of 38,939,105. The bounce came on slightly below-normal participation. On-balance volume, which adds volume on up days and subtracts it on down days, is still falling. A durable low usually needs buyers to show up in size, and that has not happened.
Fundamental Context
The selloff contrasts with the company's latest results. According to its SEC filing (Form 10-Q, filed October 29), Alphabet reported quarterly revenue of $127.58 billion for the quarter ended September 30, up 24.7% from $102.35 billion a year earlier. Net income was $26.47 billion, against $34.98 billion a year earlier, and diluted earnings per share were $2.12.
Revenue is growing quickly while profit fell year on year. Alphabet also filed a Form 8-K on November 5 reporting other material events. The filing does not specify the matter in the data available here.
Advertisement
Key Levels & Scenarios
If price falls below the 20-day support at 278.99 and then the three-month low at 276.92, the next reference is the lower Bollinger Band at 262.31. If the stock holds that zone and climbs, the first test is the 20-day average at 317.44, and beyond it the 50-day at 332.93.
Technical Verdict: HOLD (wait & see)
The code-computed technical bias is neutral: none of seven bullish signals are active, and only one of seven bearish signals is, namely the downtrend confirmed by falling OBV. The verdict is HOLD (wait & see).
Reasons:
- RSI at 29.7 and Stochastic at 11.6 show oversold conditions, which argue against chasing the decline.
- MACD at -16.589, below its signal line, and falling OBV show the downtrend has not been confirmed as over.
- Price below the 20-day average at 317.44 keeps the trend structure bearish.
Reference levels, derived only from the data:
- Ideal entry range: 276.92 to 278.99, the three-month low and 20-day support zone.
- Exit target (target price): 317.44, the 20-day average and the first overhead barrier.
- Stop loss: 267.83, which is price minus 1.5 times ATR. A close under that level takes price toward the 262.31 lower band.
The verdict is invalidated if price breaks below the 276.92 three-month low, which would confirm a fresh leg down.
In plain terms: the stock looks beaten down but has not yet shown it has turned, so the technical picture says wait. This is technical analysis, not an investment recommendation.
Advertisement
Summary Data GOOGL
Last price
284.78 USD
Change 1 day / 5 days / 1 month
0.78% / 1.77% / -19.02%
Trend / MA-cross
downtrend / none
SMA20 / SMA50
317.44 / 332.93
RSI (14) / Stochastic %K
29.7 / 11.6
Bollinger %B / ATR
20% / 11.30
Support / Resistance 20 days
278.99 / 353.78
Data as of
7 November 2026 04:00 WIB
Disclaimer: This technical analysis is generated automatically from exchange data and indicators calculated by JournalArta, for information and education only. The verdict and the entry, target and stop-loss levels are not investment advice or a solicitation to buy or sell any security. Investment decisions and their risks rest solely with the reader.