Bank of America (BAC) Stock Analysis: Falls 0.68%, Testing Support Level
Technical analysis of BAC stock on November 6, 2026: price 49.42 USD, trend downtrend, RSI 34.4, support 49.42, resistance 54.58.
By Alistair Sterling
November 9, 20264 min read
Advertisement
Logo Bank of America — JournalArta illustration
Why BAC is in focus today
Trading near its 3-month low (49.17)
Downtrend extending (5-day change -1.18%)
Selected automatically from 80 NYSE (US) stocks by a technical-signal score with daily weighted randomisation — not a recommendation.
Bank of America closed Friday's session at $49.42, sitting almost exactly on its 20-day support and a few cents above its three-month low, a test for one of the largest US lenders and a bellwether for global financial stocks.
The stock fell 0.68% on November 6, 2026 (Friday's session on the NYSE), slipping 1.18% over five days and 9.02% over one month. The previous close was $49.76. The selection signals are plain: the shares are near the three-month floor of $49.17, and the downtrend has continued.
Trend and Price Action
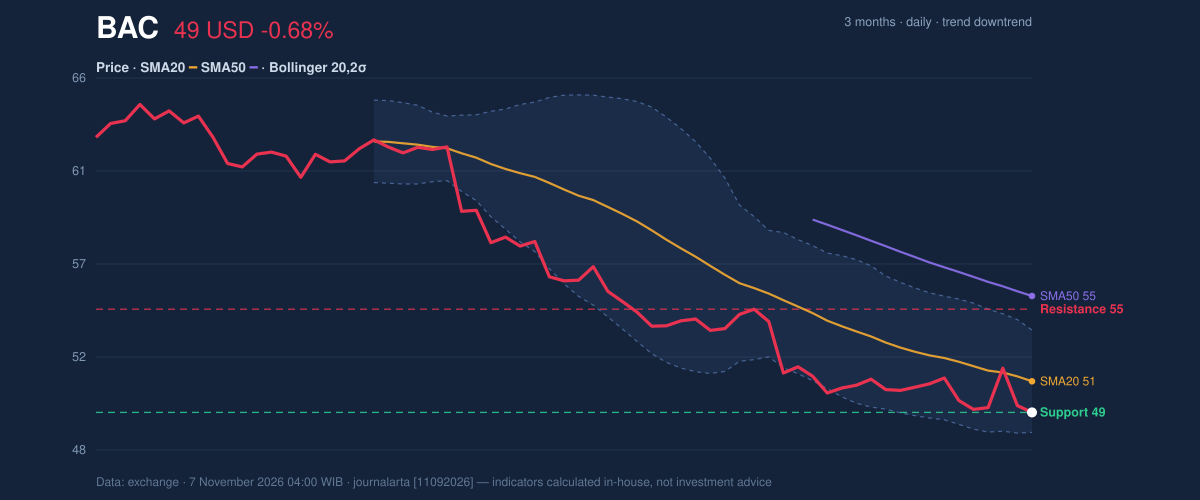
Price sits below both the 20-day average ($50.98) and the 50-day average ($55.24), the standard picture of a downtrend. The 20-day average itself fell 1.88% over five days. That is the slope of the average, not the stock's own move, and it shows the sag is not just a one-day wobble. No new moving-average crossover has formed.
The stock's range tells a similar story. Over three months it has traded between $49.17 and $65.23, and it now sits at 0% of its 20-day range, with resistance at $54.58 far overhead. In effect, the shares are pressed against the bottom of the box.
3-month price action chart of BAC: price, SMA20/50, Bollinger, support & resistance.
Advertisement
As the chart shows, the price is hugging the lower Bollinger band ($48.42), while the band midpoint ($50.98) coincides with the 20-day average. The %B reading of 20% places the price in the lower fifth of the bands. Band width of 10.0% is normal, so this is a grind lower rather than a panic.
Oscillators and Momentum
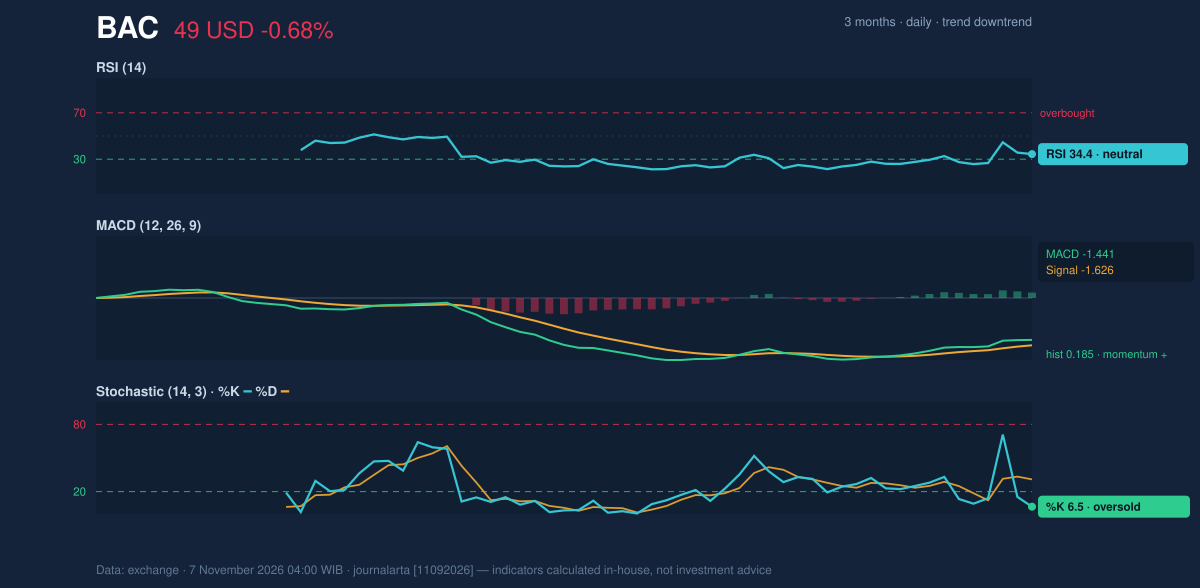
The momentum indicators disagree, which is where the story gets interesting. The Stochastic oscillator reads 6.5 (%K) against 30.9 (%D), deeply oversold, meaning the close sits near the bottom of its recent high-low range. The 14-day RSI, a gauge of how strongly recent gains compare with losses, is 34.4, still neutral. Sellers are in control, but the RSI has not yet reached the sub-30 zone that typically marks exhaustion.
MACD, which tracks the gap between fast and slow moving averages, is at -1.441 against a signal line of -1.626. The histogram is +0.185, a positive momentum reading, as the chart below shows. Put simply, the downward push is weakening even though the trend has not turned. That can precede a bounce, but a bounce is not a reversal, and the MACD remains below zero.
Momentum chart of BAC: RSI(14), MACD, Stochastic.
Advertisement
Volatility and Volume
The 14-day average true range (ATR), a measure of typical daily swing, is $1.23, or 2.5% of the price, moderate volatility. Friday's volume was 36.2 million shares, about 0.8 times the 20-day average of 44.3 million. A decline on lighter-than-normal turnover suggests sellers are not accelerating. However, on-balance volume (OBV), which adds volume on up days and subtracts it on down days, is falling, so money flow still confirms the downtrend.
The code-computed technical bias is neutral: none of seven bullish signals, and two of seven bearish ones (a bounce into the 20-day average within a downtrend, and falling OBV).
Fundamental Context
According to its SEC filing (Form 10-Q, filed October 30, 2026), Bank of America reported quarterly revenue of $29.96 billion for the quarter ended September 30, up 3.2% from $29.04 billion a year earlier. Net income was $6.93 billion, compared with $8.33 billion a year earlier, with diluted earnings per share of $0.91. Revenue grew while profit fell, a mix that helps explain why the shares have struggled to hold gains.
Advertisement
Key Levels and Scenarios
The nearest floor is the 20-day support at $49.42, backed by the three-month low of $49.17. A close below that low would open the path toward the lower Bollinger band at $48.42 and the volatility-based level of $47.58 (price minus 1.5 times ATR). On the upside, a recovery first meets the 20-day average at $50.98 and the ATR-based level of $51.26, then resistance at $54.58.
Technical Verdict: HOLD (wait & see)
The indicators point to HOLD (wait & see), in line with the neutral bias:
- Trend: price below the 20-day and 50-day averages, with the 20-day average falling, and OBV falling.
- Momentum: Stochastic is oversold at 6.5 and the MACD histogram is positive, but RSI at 34.4 is not oversold, so the signals do not align.
- Location: price sits on support, where the outcome hinges on whether $49.17 holds.
Reference levels, drawn only from the data:
- Entry range: $49.17 to $49.42 (support zone), or a close back above the 20-day average at $50.98 as confirmation
- Exit target: $50.98 first, then $54.58 (20-day resistance)
- Stop loss: $47.58 (price minus 1.5 times ATR)
The verdict is invalidated if price closes below $49.17, which would confirm a fresh three-month low.
This is technical analysis, not investment advice. In plain terms, the stock is at a make-or-break floor, and the next few sessions will show whether buyers defend it or sellers push through.
Advertisement
Summary Data BAC
Last price
49.42 USD
Change 1 day / 5 days / 1 month
-0.68% / -1.18% / -9.02%
Trend / MA-cross
downtrend / none
SMA20 / SMA50
50.98 / 55.24
RSI (14) / Stochastic %K
34.4 / 6.5
Bollinger %B / ATR
20% / 1.23
Support / Resistance 20 days
49.42 / 54.58
Data as of
7 November 2026 04:00 WIB
Disclaimer: This technical analysis is generated automatically from exchange data and indicators calculated by JournalArta, for information and education only. The verdict and the entry, target and stop-loss levels are not investment advice or a solicitation to buy or sell any security. Investment decisions and their risks rest solely with the reader.