Nike (NKE) Stock Falls 2.45%, Golden Cross Formed In Focus
Technical analysis of NKE stock on November 6, 2026: price 38.59 USD, trend uptrend, RSI 54.8, support 35.30, resistance 40.49.
Nike (NYSE: NKE) closed at $38.59 on Friday, November 6, 2026, down 2.45% on the day, according to exchange data. The drop landed three sessions after a golden cross, the point where the 20-day moving average climbs above the 50-day average. The pullback is the reason the stock is on the watchlist: a bullish crossover is being tested by a one-day dip.
Why NKE is in focus today
- Fresh golden cross: SMA20 crossed above SMA50
Selected automatically from 80 NYSE (US) stocks by a technical-signal score with daily weighted randomisation — not a recommendation.
Trend & Price Action
A moving average is the average closing price over a set number of days. Traders use it to separate a trend from daily noise. Nike's 20-day average stands at $37.72 and its 50-day at $36.91. The faster line crossed above the slower one three sessions before the latest session, so the signal is not new today. The 20-day average rose 3.27% over five days, a measure of how steeply the trend line is tilting, not of the stock's own gain.
Price is still above both averages. The stock is up 11.18% over one month, though it is down 0.21% over five days, which shows how much of the rally has already been given back. At 63% of its 20-day range, the shares sit between a 20-day support of $35.30 and resistance of $40.49. The three-month high is $42.37 and the low is $31.97.
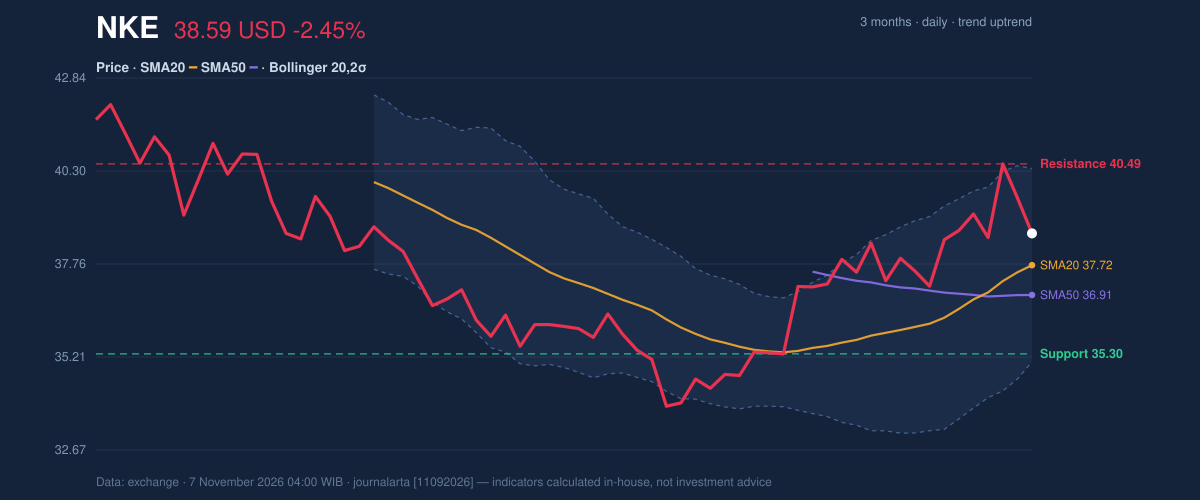
As the chart shows, Friday's slide pulled the price back toward the 20-day average rather than through it. In an uptrend, that is a classic retest: the market checks whether the old resistance zone now works as a floor.
The dip was a pause, not a break.
Oscillators & Momentum
The relative strength index (RSI), a 0-100 gauge of how fast prices have moved, reads 54.8, which is neutral. It has cooled from higher levels, and the code-computed bias flags it as rolling over from above 65. That is the one bearish signal in the set. A neutral RSI after a rally means the stock is no longer stretched, leaving room to rise without being overbought.
The stochastic oscillator, which compares the close with the recent trading range, is also neutral, with %K at 41.1 and %D at 64.0. The fast line below the slow one reflects the short-term dip. The MACD, a trend-following momentum gauge built from two averages, is at 0.749 against a signal line of 0.544. The histogram of 0.205 is positive, so upward momentum is intact despite Friday's drop.
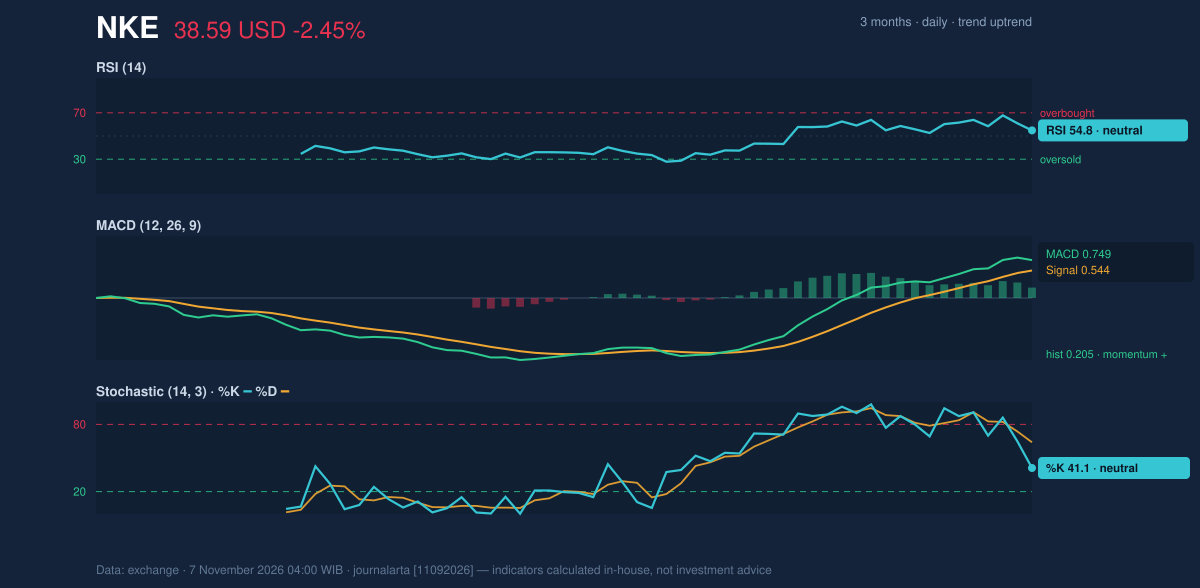
Taken together, the oscillators show short-term momentum cooling while the larger trend momentum stays positive. That pattern usually belongs to a consolidation inside an uptrend.
Volatility & Volume
Bollinger Bands, which draw a channel two standard deviations around the 20-day average, run from $35.08 to $40.36, with the midline at $37.72. The stock sits at 66% of the band's width (%B), and the band is 14.0% wide, a normal reading with no squeeze or breakout in progress. The average true range (ATR), the typical daily swing, is $1.23, or 3.2% of the price. That is moderate volatility: a move of a couple of dollars in either direction would not be unusual.
Participation was light. Friday's volume of 20,439,400 shares was 0.8 times the 20-day average of 24,717,520. A decline on below-average volume is less convincing than one on heavy selling. On-balance volume (OBV), which adds volume on up days and subtracts it on down days, is still rising, which suggests buyers have been the more active side over the recent stretch.
Fundamental Context
The price action sits against a mixed earnings backdrop. According to its Form 10-Q filed on October 2, 2026, Nike reported quarterly revenue of $11.21 billion for the quarter ended August 31, down 4.3% from $11.72 billion a year earlier. Net income was $712.0 million, against $727.0 million a year earlier, and diluted earnings per share were $0.48. Sales are shrinking while profit is holding close to last year's level, so the market is rewarding stabilization more than growth.
Technical Verdict: BUY
The technical bias is BULLISH: three of seven bullish signals are active, against one bearish. The verdict is BUY on the technical read, based on the following:
- Golden cross: the 20-day average at $37.72 is above the 50-day at $36.91, and the price is above both.
- MACD: the histogram of 0.205 stays positive, so momentum has not turned.
- OBV: rising volume flow supports the uptrend, and the pullback to the 20-day average came on 0.8 times normal volume.
- Ideal entry range: $37.72 (20-day average) to $38.59 (last close).
- Exit target: $40.49, the 20-day resistance, with $42.37, the three-month high, as the next level above it.
- Stop loss: below $36.75, which is price minus 1.5 times ATR. The deeper 20-day support sits at $35.30.
The verdict is invalidated if the price falls below $36.75, which would also put it under the 50-day average.
In plain terms: Nike's trend still points up and Friday's dip looks like a pause, but a fall below $36.75 would undercut that view.
Summary Data NKE
| Last price | 38.59 USD |
| Change 1 day / 5 days / 1 month | -2.45% / -0.21% / 11.18% |
| Trend / MA-cross | uptrend / golden |
| SMA20 / SMA50 | 37.72 / 36.91 |
| RSI (14) / Stochastic %K | 54.8 / 41.1 |
| Bollinger %B / ATR | 66% / 1.23 |
| Support / Resistance 20 days | 35.30 / 40.49 |
| Data as of | 7 November 2026 04:00 WIB |
Disclaimer: This technical analysis is generated automatically from exchange data and indicators calculated by JournalArta, for information and education only. The verdict and the entry, target and stop-loss levels are not investment advice or a solicitation to buy or sell any security. Investment decisions and their risks rest solely with the reader.
Track NKE stock price daily: live levels, support/resistance and our full NKE analysis history.