Associated British Foods Share Price Rises 0.55% (November 9, 2026): Golden Cross Formed
Technical analysis of AB Foods stock on November 9, 2026: price 2,001.00 GBp, trend uptrend, RSI 59.5, support 1,871.50, resistance 2,028.00.
Why AB Foods is in focus today
- Fresh golden cross: SMA20 crossed above SMA50
- Uptrend confirmed (5-day change 2.99%)
- Not covered by JournalArta in the last 14 days
Selected automatically from 98 LSE (UK) stocks by a technical-signal score with daily weighted randomisation — not a recommendation.
Trend & Price Action
The stock sits above both averages. The 20-day average stands at 1,939.55 and the 50-day at 1,908.19, so the price is about 61 pence above the short average. The 20-day average itself rose 1.98% over five days. That figure describes the average, not the share price, but it shows the upward drift is steady rather than a single-day jump. Timing is worth stating plainly. The cross formed three sessions before Monday, so it is not a signal from the latest session. Crosses are lagging by design: they confirm that a move has already happened rather than predict one.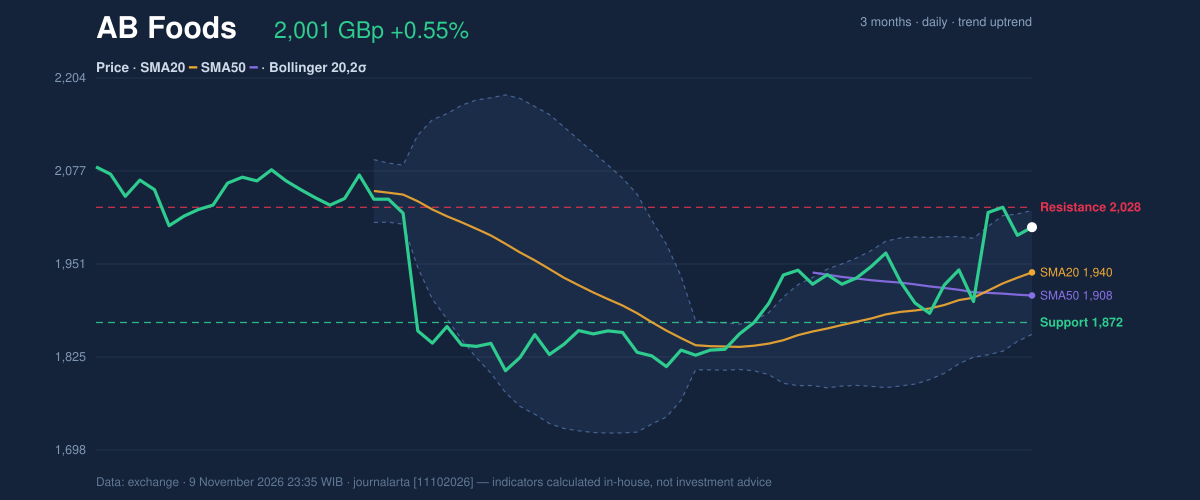
Oscillators & Momentum
Momentum indicators measure how fast a price is moving, not just where it is. Here they largely agree with the trend without flashing excess. The 14-day Relative Strength Index, a gauge from 0 to 100 where readings above 70 suggest a stock has run hot, is 59.5. That is neutral, with room to rise before it enters overbought territory. The Stochastic oscillator tells a similar story, with %K at 72.2 and %D at 74.9, both neutral. The two readings sit closer to the upper end of their scales, so a pause would not be unusual. The MACD line, which tracks the gap between short and long-term price averages, stands at 25.341 against a signal line of 15.292. The histogram of 10.049 is positive, meaning upward momentum is still widening rather than fading.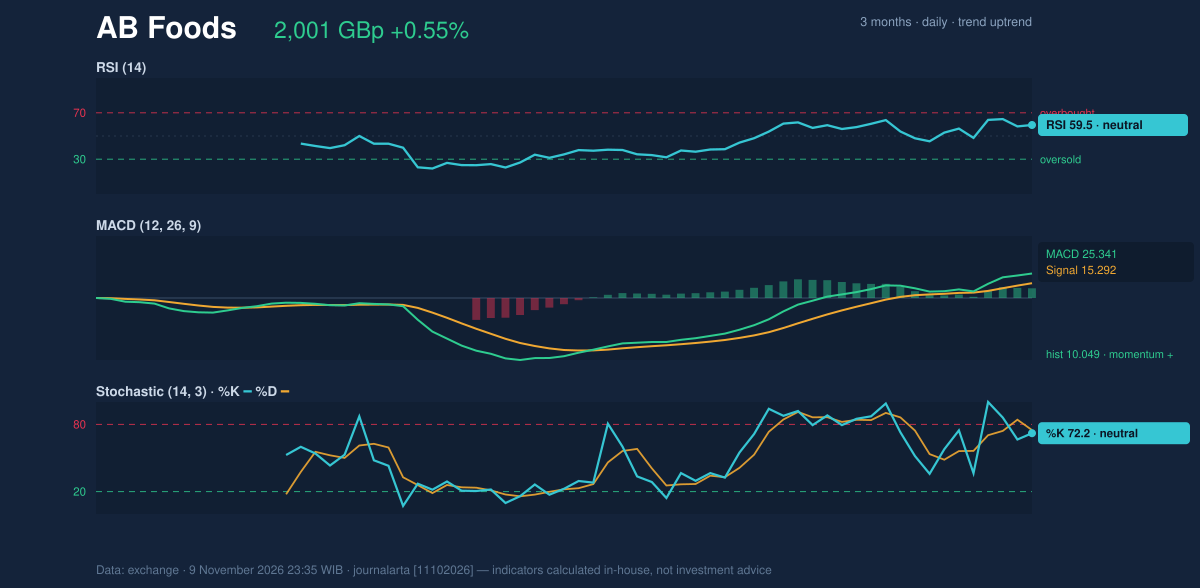
Volatility & Volume
The Bollinger Bands, which draw a channel two standard deviations around the 20-day average, run from 1,855.43 to 2,023.67. The price sits at 87% of the band's width, close to the upper edge, while the band width of 8.7% is normal. Nothing in the data points to a volatility squeeze or an unusual expansion. The Average True Range, a measure of typical daily movement, is 49.64 pence, or 2.5% of the price. That is moderate volatility. In practical terms, a daily swing of around 50 pence would be ordinary for this stock. Volume deserves a note of caution. Monday's volume was 611,168 shares against a 20-day average of 782,342, or 0.8 times normal. A rise on thinner-than-usual trading means fewer participants backed the latest step up. Against that, On-Balance Volume, which adds volume on up days and subtracts it on down days, is rising. That suggests buying pressure has outweighed selling over the recent period.Key Levels & Scenarios
The 20-day support stands at 1,871.50 and resistance at 2,028.00, only 27 pence above Monday's close. The upper Bollinger Band at 2,023.67 sits in the same area, so that zone is a cluster where several signals overlap. If the price clears 2,028.00 on stronger volume, the next reference is the three-month high of 2,130.00. If it fails to hold the 20-day average near 1,939.55, attention shifts toward the lower support.Technical Verdict: BUY
JournalArta's research model rates the setup BUY, with a score of +84 on a scale from −100 to +100. The threshold for a Buy call is +60. The code found three bullish technical signals and none bearish. The strongest reasons: - Golden cross: the 20-day average sits above the 50-day, three sessions after the cross. - Trend structure: the price is above the 50-day average in an uptrend, with a pullback toward the 20-day average. - Volume confirmation: On-Balance Volume is rising, even though the latest session's volume was light. The levels computed for this verdict, valid until 7 December 2026: - Entry range: 1,964 – 2,001 - Exit target 1: 2,128 (reward/risk 1.5) - Exit target 2: 2,256 (reward/risk 3.0) - Stop loss: 1,916 The verdict is invalidated if the price falls below 1,916. In plain terms, the chart patterns currently lean in the stock's favour, but this is technical analysis, not investment advice. The next date to watch is December 7, when these levels expire and the model recalculates. | Indicator | Value | |---|---| | Last price | 2,001.00 GBp | | 1-day / 5-day / 1-month change | 0.55% / 2.99% / 7.81% | | SMA20 / SMA50 | 1,939.55 / 1,908.19 | | Bollinger (upper / middle / lower) | 2,023.67 / 1,939.55 / 1,855.43 | | RSI(14) | 59.5 | | Stochastic %K / %D | 72.2 / 74.9 | | MACD / signal / histogram | 25.341 / 15.292 / 10.049 | | ATR(14) | 49.64 | | Volume vs 20-day average | 0.8× | | Support / resistance (20-day) | 1,871.50 / 2,028.00 | | 3-month low / high | 1,777.00 / 2,130.00 |Summary Data AB Foods
| Last price | 2,001.00 GBp |
| Change 1 day / 5 days / 1 month | 0.55% / 2.99% / 7.81% |
| Trend / MA-cross | uptrend / golden |
| SMA20 / SMA50 | 1,939.55 / 1,908.19 |
| RSI (14) / Stochastic %K | 59.5 / 72.2 |
| Bollinger %B / ATR | 87% / 49.64 |
| Support / Resistance 20 days | 1,871.50 / 2,028.00 |
| Data as of | 9 November 2026 23:35 WIB |
| JournalArta research verdict (score) | Buy (+84) |
| Entry zone | 1,964 – 2,001 |
| Target 1 / 2 | 2,128 / 2,256 |
| Stop loss | 1,916 |
| Reward/risk | 1.5 / 3.0 |
Disclaimer: This technical analysis is generated automatically from exchange data and indicators calculated by JournalArta, for information and education only. The verdict and the entry, target and stop-loss levels are not investment advice or a solicitation to buy or sell any security. Investment decisions and their risks rest solely with the reader.
Track AB Foods share price daily: live levels, support/resistance and our full AB Foods analysis history.