GSK Share Price Rises 0.77% (November 9, 2026): Golden Cross Formed
Technical analysis of GSK stock on November 9, 2026: price 1,904.50 GBp, trend uptrend, RSI 57.5, support 1,753.00, resistance 1,923.50.
GSK plc closed at 1,904.50 pence on the London Stock Exchange on Monday, November 9, 2026, up 0.77% from a previous close of 1,890.00, according to exchange data. The move is small. The signals behind it are not: the 20-day moving average crossed above the 50-day average, the stock's three-session-old golden cross, and it did so inside a confirmed uptrend, with the price up 4.38% over five days and 7.54% over one month.
Why GSK is in focus today
- Fresh golden cross: SMA20 crossed above SMA50
- Uptrend confirmed (5-day change 4.38%)
Selected automatically from 98 LSE (UK) stocks by a technical-signal score with daily weighted randomisation — not a recommendation.
Trend & Price Action
A golden cross happens when a shorter-term average climbs through a longer-term one. It tells readers that recent prices are now consistently higher than the prices of the past two months. Here the cross formed three sessions before the latest session, so it is recent but not brand new. The 20-day average sits at 1,863.25 and the 50-day at 1,843.42. The shares trade above both, which keeps the structure orderly.
The 20-day average rose 1.61% over five days. That is the slope of the average itself, not the stock's own gain, and it shows the trend is building steadily rather than lurching.
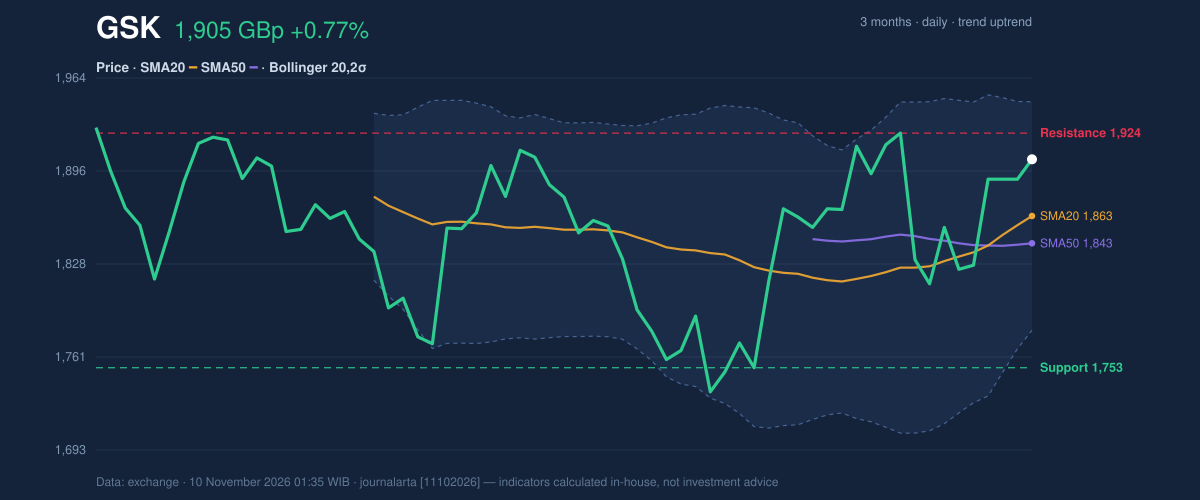
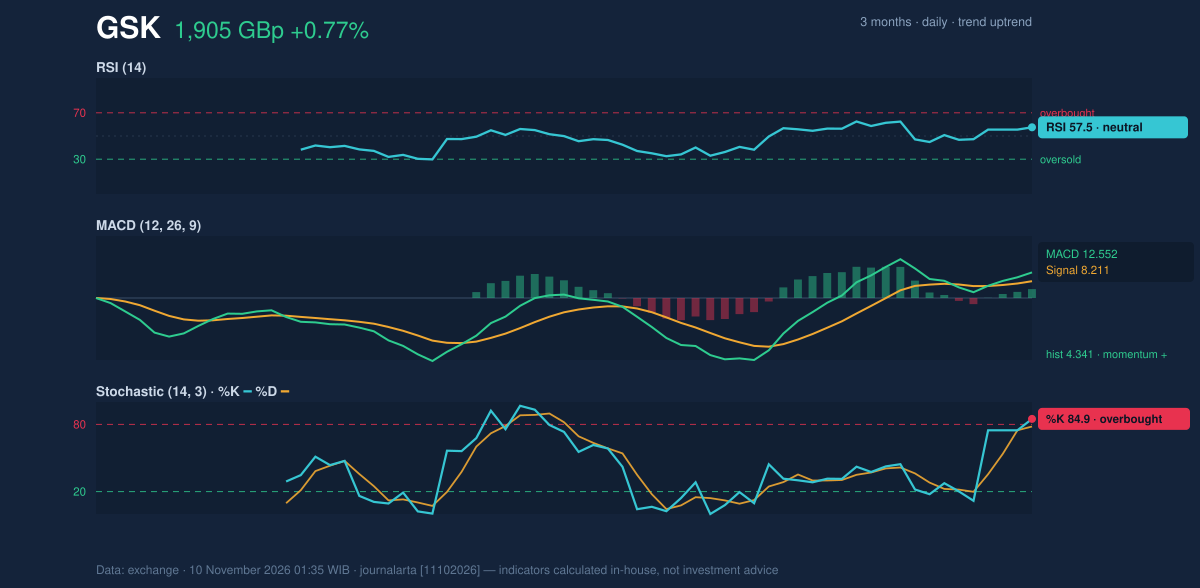
As shown in the chart, the price sits at 89% of its 20-day range, between support at 1,753.00 and resistance at 1,923.50. That puts GSK just under the ceiling of its recent range. The three-month range runs from a low of 1,735.50 to a high of 2,158.00, so the stock has recovered much of the ground between its floor and its peak without testing the top.
Oscillators & Momentum
Momentum indicators mostly agree with the trend, with one caveat. The 14-day RSI reads 57.5, which is neutral. It shows buyers in control without the stretched readings that usually come before a pause. The MACD line stands at 12.552 against a signal line of 8.211, leaving a histogram of 4.341. A positive histogram means short-term momentum is running ahead of its own recent average.
The Stochastic oscillator is the warning light. Its %K reads 84.9 and %D 78.1, both in overbought territory. The Stochastic compares the latest close with the recent trading range, so a high reading means the shares are closing near the top of that range. Overbought does not mean a reversal is due. In strong uptrends the reading can stay elevated for some time. It does mean the stock has less room for error in the short term.
Volatility & Volume
Bollinger Bands, which frame normal price swings around the 20-day average, run from 1,780.19 to 1,946.31. The band width is 8.9%, a normal reading, and the %B value of 75% places the price in the upper part of the channel without pressing against the upper band. The 14-day Average True Range is 50.30 pence, or 2.6% of the price, which points to moderate volatility. Daily swings of that size are what the stock has been producing recently.
Volume offers a mixed message. Monday's turnover was 4,196,907 shares, only 0.5 times the 20-day average of 7,752,043, which counts as thin. A rise on light volume suggests fewer participants were driving the move. Against that, on-balance volume (OBV), which adds volume on up days and subtracts it on down days, is rising. That supports the idea that buying pressure has outweighed selling over the longer run, even if Monday itself was quiet.
Key Levels & Scenarios
The nearest test is resistance at 1,923.50, only a short step above the last close. A close above it would open the path toward the levels in the verdict below. If the stock fails to hold the 20-day average at 1,863.25, the 50-day average at 1,843.42 becomes the next area to watch, and the 20-day support at 1,753.00 sits further down. A drop through those averages would put the golden cross under strain.
Technical Verdict: BUY
JournalArta's research model rates GSK BUY with a score of +84 on a scale of −100 to +100. The threshold for a buy call is +60. Three bullish technical signals are active and none are bearish. The strongest reasons:
- Golden cross: the 20-day average (1,863.25) is above the 50-day (1,843.42), with the price above both.
- Trend confirmation: the uptrend is supported by rising OBV and a positive MACD histogram of 4.341.
- Room in the range: RSI at 57.5 is neutral, so momentum is not yet stretched on that measure.
The main risk is the overbought Stochastic (%K 84.9), along with thin volume at 0.5 times the 20-day average.
- Entry range: 1,867 – 1,904 pence
- Exit target 1: 2,031 pence (reward/risk 1.5)
- Exit target 2: 2,159 pence (reward/risk 3.0)
- Stop loss: 1,819 pence
- Valid until: 8 December 2026
The verdict is invalidated if the price falls below 1,819. This is technical analysis, not an investment recommendation.
In plain terms: the chart for GSK currently leans positive, but a drop below 1,819 pence would mean the pattern has failed.
Summary Data GSK
| Last price | 1,904.50 GBp |
| Change 1 day / 5 days / 1 month | 0.77% / 4.38% / 7.54% |
| Trend / MA-cross | uptrend / golden |
| SMA20 / SMA50 | 1,863.25 / 1,843.42 |
| RSI (14) / Stochastic %K | 57.5 / 84.9 |
| Bollinger %B / ATR | 75% / 50.30 |
| Support / Resistance 20 days | 1,753.00 / 1,923.50 |
| Data as of | 10 November 2026 01:35 WIB |
| JournalArta research verdict (score) | Buy (+84) |
| Entry zone | 1,867 – 1,904 |
| Target 1 / 2 | 2,031 / 2,159 |
| Stop loss | 1,819 |
| Reward/risk | 1.5 / 3.0 |
Disclaimer: This technical analysis is generated automatically from exchange data and indicators calculated by JournalArta, for information and education only. The verdict and the entry, target and stop-loss levels are not investment advice or a solicitation to buy or sell any security. Investment decisions and their risks rest solely with the reader.
Track GSK share price daily: live levels, support/resistance and our full GSK analysis history.