Unilever Share Price Technicals: Falls 0.28% on Monday, Momentum Gains
Technical analysis of Unilever stock on November 9, 2026: price 4,916.00 GBp, trend uptrend, RSI 55.1, support 4,710.50, resistance 5,032.00.
By Elena Vance
November 10, 20265 min read
Advertisement
Logo Unilever plc — JournalArta illustration
Unilever shares closed at 4,916.00 pence on the London Stock Exchange on Monday, November 9, 2026, down 0.28% from the previous close of 4,930.00 pence. The one-day dip is small, but the signals behind it are what make the stock worth watching: the shares are up 0.31% over five days and 3.76% over one month, and two bullish technical signals have appeared at once while Bollinger Bands are tightening.
Trend & Price Action
The structure is orderly. The price sits above both the 20-day average at 4,890.90 pence and the 50-day average at 4,744.96 pence, and the shorter average is above the longer one. That ordering is the textbook signature of an uptrend, and the 20-day average rose 1.53% over five days, so the slope confirms it. Note what that last figure measures: it is the pace of the average itself, not the share price, which gained only 0.31% over the same window.
No new moving-average cross has formed, so there is no fresh "golden cross" headline to point to. The trend is established rather than newly triggered. Together with the rise in the 20-day average, that suggests steady accumulation over several weeks rather than a sudden burst.
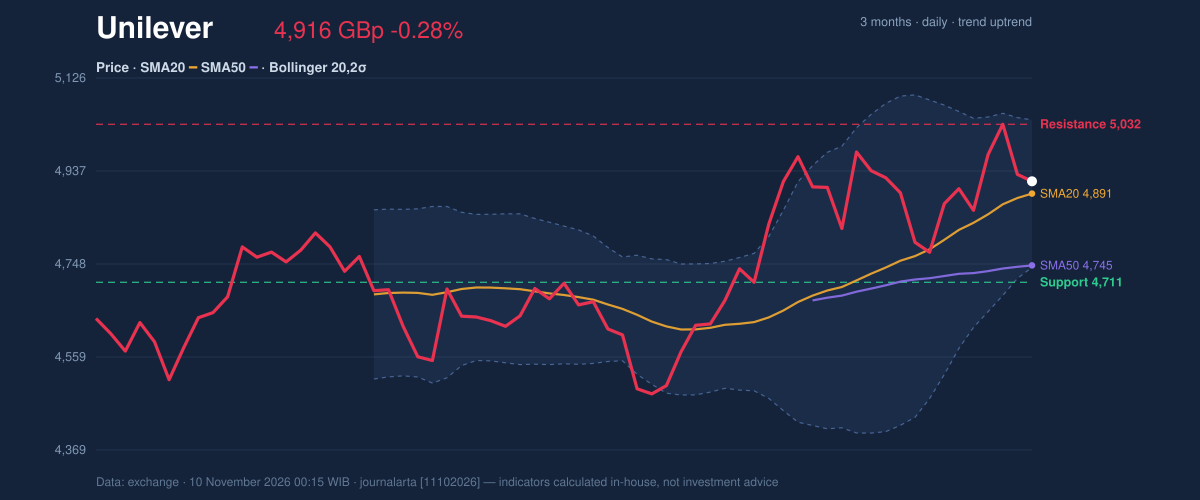
The price is only about 25 pence above its 20-day average, a gap that fits one of the two bullish signals flagged: a pullback to the 20-day average within an uptrend. In plain terms, the shares have eased back to a level that has recently acted as a floor, while the larger trend remains intact. As shown in the chart below, price has been hugging the middle of its recent range.
3-month price action chart of Unilever: price, SMA20/50, Bollinger, support & resistance.
Advertisement
The shares sit at 64% of their 20-day range, bounded by support at 4,710.50 pence and resistance at 5,032.00 pence. The three-month high is 5,109.00 pence and the low 4,463.25 pence, so the stock trades in the upper half of its quarterly band without testing the ceiling.
Oscillators & Momentum
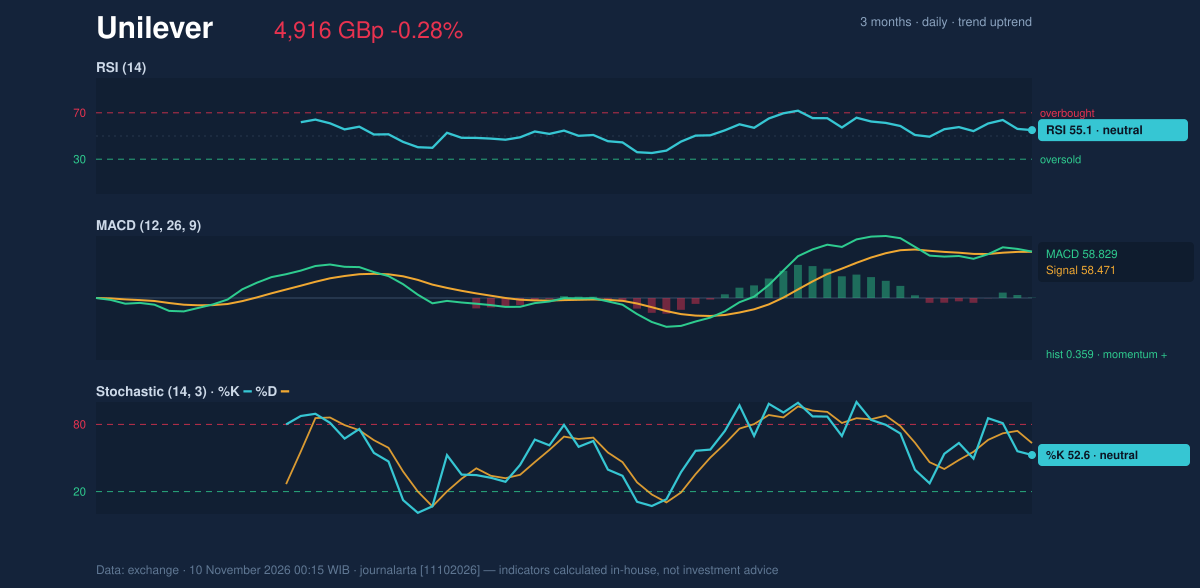
Momentum is positive but not stretched. The 14-day Relative Strength Index (RSI), which measures the speed of recent gains against losses on a 0–100 scale, reads 55.1, a neutral zone well short of the 70 level usually associated with overbought conditions. That leaves room for further gains without the shares looking overheated.
The Stochastic oscillator, which shows where the close sits within its recent high-low range, is also neutral, with %K at 52.6 and %D at 63.3. %K below %D is a mild sign of short-term cooling, consistent with Monday's small decline.
The more interesting reading is the Moving Average Convergence Divergence (MACD) indicator. The line stands at 58.829 against a signal line of 58.471, leaving a histogram of 0.359. The gap is razor-thin, but the histogram has just turned positive, the second bullish signal in the data. Such early turns can fade quickly, so the narrow margin deserves caution; it shows momentum improving, not yet strong.
Momentum chart of Unilever: RSI(14), MACD, Stochastic.
Advertisement
Volatility & Volume
Bollinger Bands, which draw a channel two standard deviations around the 20-day average, span 4,740.93 to 5,040.87 pence. Their width has narrowed to 6.1% of price, a "squeeze" that often precedes a larger move, though it does not indicate direction. With the %B reading at 58%, the price sits slightly above the middle line, a mildly constructive position.
The 14-day Average True Range (ATR), a gauge of typical daily movement, is 129.48 pence, or 2.6% of the price, which counts as moderate volatility. In practical terms, a swing of that size is ordinary for this stock and should not by itself be read as a signal.
Volume is the weak spot. Monday's turnover of 2,654,759 shares was only 0.7 times the 20-day average of 3,608,108, and On-Balance Volume (OBV), which tallies volume on up days against down days, is falling. That is a divergence worth flagging: the price trend is rising while participation is not confirming it. A breakout from the squeeze would carry more weight if volume expanded alongside it.
Advertisement
Key Levels & Scenarios
The upper Bollinger Band at 5,040.87 pence sits almost on top of the 20-day resistance at 5,032.00 pence, creating a cluster near 5,030–5,040 pence. A close through that zone would put the three-month high of 5,109.00 pence in view. On the downside, the 20-day average at 4,890.90 pence is the first cushion, followed by the 50-day average at 4,744.96 pence and 20-day support at 4,710.50 pence. A decisive slide below the lower band at 4,740.93 pence would weaken the pullback-in-an-uptrend reading.
Technical Verdict: BUY
JournalArta's research model scores Unilever at +76 on a scale from −100 to +100, above the +60 threshold for a BUY call. The strongest reasons:
- Trend structure: the price is above the 50-day average, and the 20-day average is above the 50-day, in an uptrend.
- Signal balance: two bullish signals (a MACD histogram that has just turned positive, and a pullback to the SMA20) against zero bearish.
- Room to run: RSI at 55.1 is neutral, not overbought.
The call is not risk-free: falling OBV and volume at 0.7 times average show weak participation, and the narrowing bands mean direction is still unproven.
Levels computed by the model:
- Entry range: 4,820 – 4,916 pence
- Exit target 1: 5,264 pence (reward/risk 1.5)
- Exit target 2: 5,612 pence (reward/risk 3.0)
- Stop loss: 4,684 pence
The verdict is invalidated if the price breaks below 4,684 pence. It is valid until 8 December 2026.
In plain terms, the technical picture for Unilever leans positive, with an established uptrend and improving momentum, though thin trading volume means the case is not yet fully confirmed. This is technical analysis, not an investment recommendation.
Indicator
Value
Last price
4,916.00 GBp
Change (1 day / 5 days / 1 month)
-0.28% / 0.31% / 3.76%
SMA20 / SMA50
4,890.90 / 4,744.96
Bollinger (lower / middle / upper)
4,740.93 / 4,890.90 / 5,040.87
RSI(14)
55.1
Stochastic %K / %D
52.6 / 63.3
MACD / signal / histogram
58.829 / 58.471 / 0.359
ATR(14)
129.48 (2.6%)
Volume vs 20-day average
2,654,759 vs 3,608,108 (0.7×)
Support / resistance (20 days)
4,710.50 / 5,032.00
3-month low / high
4,463.25 / 5,109.00
Advertisement
Summary Data Unilever
Last price
4,916.00 GBp
Change 1 day / 5 days / 1 month
-0.28% / 0.31% / 3.76%
Trend / MA-cross
uptrend / none
SMA20 / SMA50
4,890.90 / 4,744.96
RSI (14) / Stochastic %K
55.1 / 52.6
Bollinger %B / ATR
58% / 129.48
Support / Resistance 20 days
4,710.50 / 5,032.00
Data as of
10 November 2026 00:15 WIB
JournalArta research verdict (score)
Buy (+76)
Entry zone
4,820 – 4,916
Target 1 / 2
5,264 / 5,612
Stop loss
4,684
Reward/risk
1.5 / 3.0
Disclaimer: This technical analysis is generated automatically from exchange data and indicators calculated by JournalArta, for information and education only. The verdict and the entry, target and stop-loss levels are not investment advice or a solicitation to buy or sell any security. Investment decisions and their risks rest solely with the reader.