British American Tobacco Share Price Analysis: Falls 1.97%, Momentum Weakens
Technical analysis of BAT stock on November 9, 2026: price 4,477.00 GBp, trend sideways, RSI 53.1, support 4,225.00, resistance 4,717.00.
By Alistair Sterling
November 10, 20264 min read
Advertisement
Logo British American Tobacco — JournalArta illustration
Why BAT is in focus today
MACD histogram has just turned negative
Selected automatically from 98 LSE (UK) stocks by a technical-signal score with daily weighted randomisation — not a recommendation.
Shares in British American Tobacco fell 1.97% to 4,477.00 pence on Monday, November 9, 2026, from a previous close of 4,567.00. The drop pushed the stock fractionally under its 20-day average and tripped a signal that explains why it is on the watchlist today: the MACD histogram has just turned negative.
One day does not make a trend. Over five days the shares are down 2.12%, yet over one month they remain up 6.75%. This is a stock cooling off after a strong month rather than one in free fall, and the details decide which reading wins.
Trend & Price Action
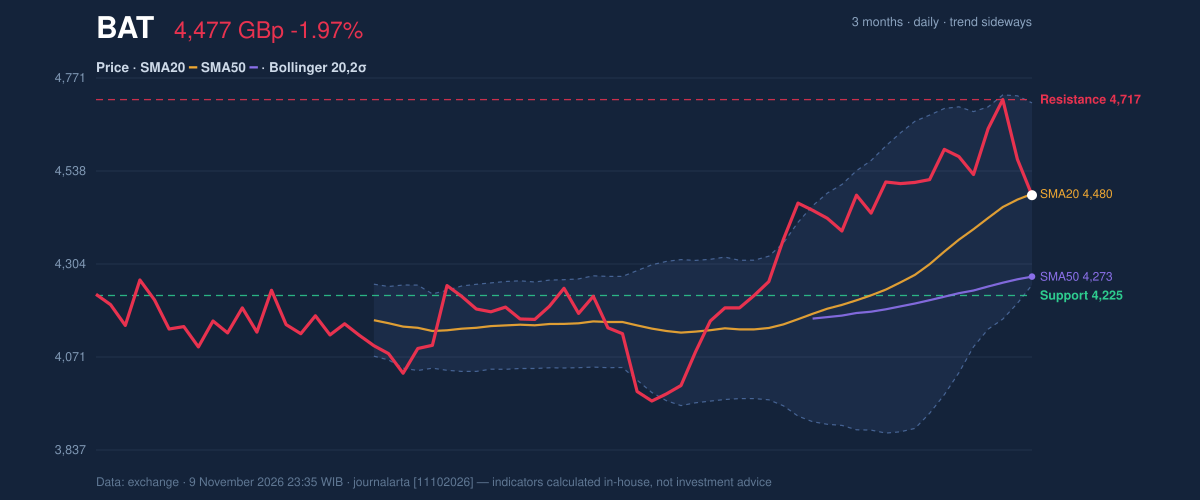
3-month price action chart of BAT: price, SMA20/50, Bollinger, support & resistance.
The 20-day moving average sits at 4,480.15, so the last price is just under the 20-day average. The 50-day average is lower at 4,272.56. The 20-day average has itself risen 2.64% over five days, and there is no new moving-average crossover. The short average has stayed above the long one, which keeps the broader picture constructive even as the stock itself drifts sideways.
The code-based signal scan reads this as a pullback to the 20-day line within an uptrend. Price is still above the 50-day average, the usual test of whether buyers defend a dip.
As shown in the chart, price is stuck in the middle of its recent range.
[GRAFIK-PRICE-PLACEHOLDER]
The 20-day range runs from support at 4,225.00 to resistance at 4,717.00, and the price sits at about 51% of that span. The three-month high is 4,767.00 and the three-month low is 3,947.00. Having pulled back from the upper part of that range, the shares have room on both sides.
Advertisement
Oscillators & Momentum
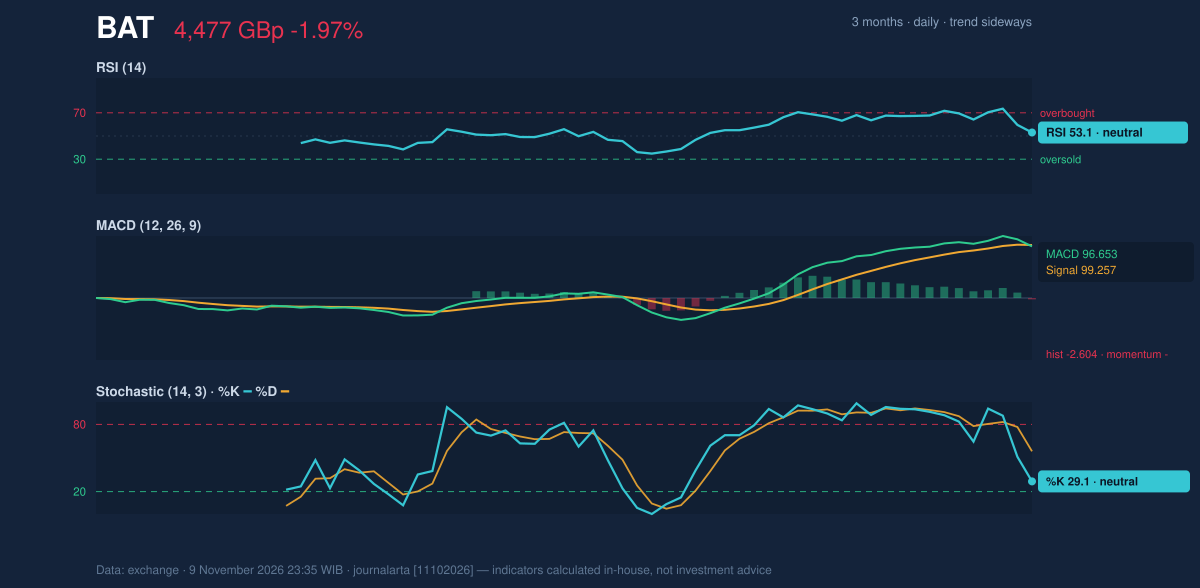
Momentum is where the picture turns less comfortable. The RSI(14) reads 53.1, which is neutral. But the signal scan flags it as rolling over from above 65, meaning buying pressure has faded from a stronger reading earlier in the move.
The MACD line stands at 96.653 against a signal line of 99.257, leaving a histogram of -2.604. MACD measures the gap between a fast and slow average of price. When the line slips below its signal line, it says upward momentum is losing pace, even if price has not yet broken down. The reading is shallow, so this is a warning light rather than an alarm.
The Stochastic %K is 29.1 against a %D of 56.0, a neutral reading. The gap, with the fast line well below the slow one, shows the latest sessions have closed near the lower end of the recent range.
Momentum chart of BAT: RSI(14), MACD, Stochastic.
Volatility & Volume
The Bollinger Bands, which wrap a volatility envelope around the 20-day average, run from 4,251.48 to 4,708.82. The %B reading of 49% puts the price almost exactly on the middle band. The band width of 10.2% is normal, so there is no squeeze and no sign of a sudden expansion in swings.
The Average True Range, a gauge of typical daily movement, is 105.22 pence, or 2.4% of the price. That is moderate volatility. A move of one and a half ATR from here would reach 4,319.16 on the downside or 4,634.84 on the upside, both inside the 20-day range.
Volume tells a quieter story. The latest session traded 2,290,408 shares, about 0.8 times the 20-day average of 2,806,669. The decline came on thin participation, which usually carries less weight than a drop on heavy trading. On-balance volume, which tallies volume on up days against down days, is still rising, so the money flow has not turned against the shares.
Advertisement
Key Levels & Scenarios
If the shares close above the 20-day resistance at 4,717.00, they would be testing the three-month high of 4,767.00 and would end the sideways pattern. If they fail to hold the 20-day support at 4,225.00, the next reference is the three-month low of 3,947.00. Between those two lines, the signals offset each other.
Technical Verdict: HOLD (wait & see)
JournalArta's research score is +32 on a scale from -100 to +100, well short of the +60 needed for a buy call and the -60 that would trigger a sell call. The reasons for waiting:
Trend and momentum disagree. Price is above the 50-day average, but the MACD histogram has just turned negative.
Signals are split. One bullish signal (the pullback to the 20-day average) faces two bearish ones (RSI rolling over, MACD turning negative).
The drop lacked conviction. Volume was 0.8 times normal and on-balance volume is still rising.
The verdict is invalidated if the price closes above 4,717.00 or below 4,225.00. Both are conditional scenarios built only from the reference levels:
Upside scenario: entry zone on a close above 4,717.00; exit target 4,767.00 (three-month high); stop-loss protection at 4,634.84.
Downside scenario: entry zone on a break below 4,225.00; exit target 3,947.00 (three-month low); stop-loss protection at 4,319.16.
Advertisement
In plain terms, the chart does not yet give a clear edge in either direction, so the technical call is to wait for the price to leave its range. This is technical analysis, not an investment recommendation.
Summary Data BAT
Last price
4,477.00 GBp
Change 1 day / 5 days / 1 month
-1.97% / -2.12% / 6.75%
Trend / MA-cross
sideways / none
SMA20 / SMA50
4,480.15 / 4,272.56
RSI (14) / Stochastic %K
53.1 / 29.1
Bollinger %B / ATR
49% / 105.22
Support / Resistance 20 days
4,225.00 / 4,717.00
Data as of
9 November 2026 23:35 WIB
JournalArta research verdict (score)
Hold (+32)
Disclaimer: This technical analysis is generated automatically from exchange data and indicators calculated by JournalArta, for information and education only. The verdict and the entry, target and stop-loss levels are not investment advice or a solicitation to buy or sell any security. Investment decisions and their risks rest solely with the reader.