Vodafone Share Price Analysis: Rises 0.39%, Testing Support Level
Technical analysis of Vodafone stock on November 9, 2026: price 116.95 GBp, trend downtrend, RSI 43.6, support 116.50, resistance 122.05.

Vodafone Group shares closed at 116.95 pence on the London Stock Exchange on Monday, November 9, 2026, up 0.39% from the previous close of 116.50. The move was small. Yet it is the kind of bounce that technical analysts watch closely in a downtrend: the shares rose toward their 20-day average without reaching it, and that pattern is the one bearish signal in the day's screen, with no bullish counterpart.
Trend & Price Action
The trend is down. The stock trades below both its 20-day average of 118.64 and its 50-day average of 122.78, and the 20-day line sits under the 50-day line. A moving average is simply the mean closing price over a set number of sessions, so shares below both lines are being priced lower than their recent history. The 20-day average itself fell 0.88% over five days. There was no new crossover between the two averages on the latest session. The bearish alignment is already established rather than freshly formed.
Over longer windows the price has barely moved: a 0.09% gain over five days and a 0.21% change over one month. A stock that has gone nowhere in a month while sitting under falling averages is stuck rather than recovering. The 3-month range runs from a high of 132.07 to a low of 114.30, and the latest close sits at roughly 8% of the 20-day range. That puts it near the bottom of recent trading, just above the 20-day support at 116.50.
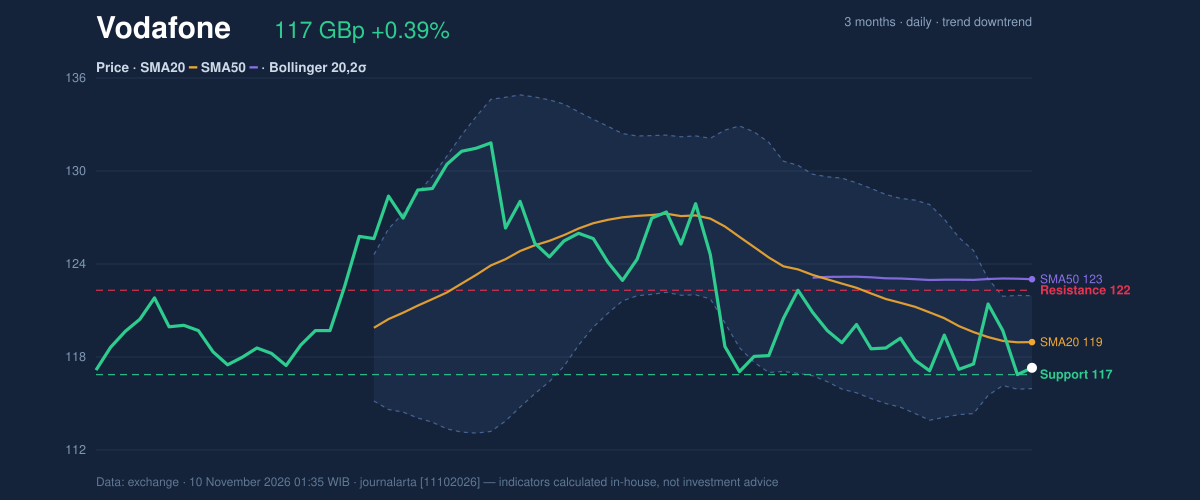
As shown in the chart, price is pressed against the lower half of the Bollinger Bands, the envelope drawn two standard deviations around the 20-day average. The bands sit at 121.70 (upper), 118.64 (middle) and 115.58 (lower), and the close registers a %B reading of 22%. In plain terms, the price is in the lower quarter of its normal statistical range.
Oscillators & Momentum
Momentum indicators do not confirm the downtrend with conviction. The 14-day Relative Strength Index, which measures the pace of recent gains against losses on a 0–100 scale, stands at 43.6. That is neutral, below the midpoint but well clear of the 30 level that usually marks oversold conditions. The Stochastic oscillator, which compares the close to the recent trading range, reads 31.7 (%K) and 35.8 (%D), also neutral.
The MACD line is at -1.267 against a signal line of -1.322. The gap gives a positive histogram of 0.055. MACD tracks the distance between a fast and a slow average. A negative reading shows the trend is still down, while a histogram turning positive means the downward push is easing. It is an early sign of fading selling pressure, not a reversal.
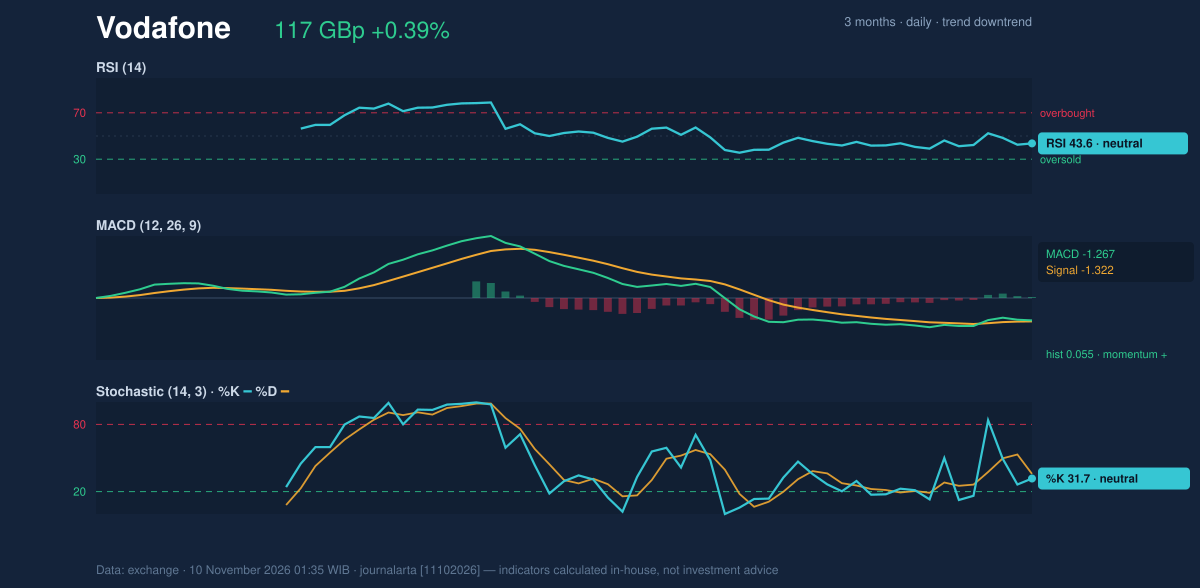
The oscillators therefore split the picture. Trend says down; momentum says the sellers are tiring. That disagreement is why the overall score is not decisive.
Volatility & Volume
The Bollinger Bands are only 5.2% wide and narrowing, a squeeze. Narrow bands mean prices have been moving in a tight range, and such periods are often followed by a larger move. The squeeze does not say which way. The 14-day Average True Range, a measure of the typical daily swing, is 2.59, or 2.2% of the price. That is moderate volatility.
Participation was light. Volume on the latest session was 41,294,069 shares, about 0.7 times the 20-day average of 59,692,765. Thin volume on a bounce means few traders pushed the price up, so the gain carries less weight. On-balance volume, which adds volume on up days and subtracts it on down days, is rising, a mild point in the bulls' favour that does not yet outweigh the quiet tape.
Key Levels & Scenarios
The 20-day support at 116.50 lies only 0.45 pence below the close, so the shares are sitting almost on it. If it fails to hold, the 3-month low of 114.30 comes into view, followed by the 1.5×ATR level at 113.06. On the upside, the 20-day average at 118.64 is the first hurdle, then the upper Bollinger Band at 121.70 and the 20-day resistance at 122.05. A close above 122.05 would also clear the 50-day average at 122.78 within reach, which would begin to repair the trend structure.
Technical Verdict: HOLD (wait & see)
The JournalArta research score is -58 on a scale from -100 to +100, short of the -60 threshold for a sell reading and far from the +60 needed for a buy reading. The call is HOLD (wait & see), for three reasons:
- Price is below the 50-day average and the 20-day average is below the 50-day, a confirmed downtrend.
- RSI at 43.6 and the positive MACD histogram show momentum is not yet aligned with the trend.
- Volume at 0.7× its 20-day average gives neither side a convincing breakout.
The verdict is invalidated if price closes above 122.05 or breaks below 116.50. Both are conditional scenarios built from the reference levels:
- Upside scenario: entry range on a close above 122.05; exit target 132.07 (3-month high); stop-loss at 120.84 (price + 1.5×ATR).
- Downside scenario: entry range on a break below 116.50; exit target 114.30 (3-month low); stop-loss at 118.64 (20-day average).
This is technical analysis, not investment advice. In plain terms, the signals say wait: the shares trade at 116.95 pence, 8% of the way up their 20-day range, and neither direction has been confirmed.
Summary Data Vodafone
| Last price | 116.95 GBp |
| Change 1 day / 5 days / 1 month | 0.39% / 0.09% / 0.21% |
| Trend / MA-cross | downtrend / none |
| SMA20 / SMA50 | 118.64 / 122.78 |
| RSI (14) / Stochastic %K | 43.6 / 31.7 |
| Bollinger %B / ATR | 22% / 2.59 |
| Support / Resistance 20 days | 116.50 / 122.05 |
| Data as of | 10 November 2026 01:35 WIB |
| JournalArta research verdict (score) | Hold (-58) |
Disclaimer: This technical analysis is generated automatically from exchange data and indicators calculated by JournalArta, for information and education only. The verdict and the entry, target and stop-loss levels are not investment advice or a solicitation to buy or sell any security. Investment decisions and their risks rest solely with the reader.
Track Vodafone share price daily: live levels, support/resistance and our full Vodafone analysis history.