Axon Enterprise (AXON) Stock Falls 3.14% on Monday, RSI Oversold
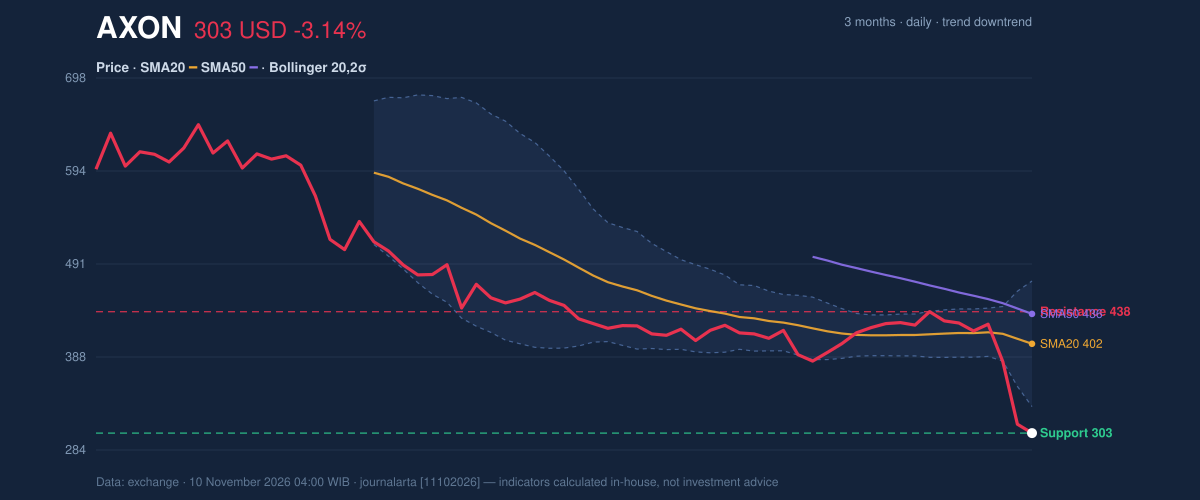
Technical analysis of AXON stock on November 9, 2026: price 303.18 USD, trend downtrend, RSI 22.6, support 303.18, resistance 438.05.
Why AXON is in focus today
- Volume at 2.4× the 20-day average
- RSI(14) at 22.6 — oversold zone
- Downtrend extending (5-day change -28.74%)
- Not covered by JournalArta in the last 14 days
Selected automatically from 100 NASDAQ (US) stocks by a technical-signal score with daily weighted randomisation — not a recommendation.
Trend & Price Action
Oscillators & Momentum
Momentum indicators agree with the trend but warn of stretched conditions. The 14-day Relative Strength Index (RSI), which measures the speed of recent gains against losses, reads 22.6. Readings under 30 are considered oversold. The Stochastic oscillator, which shows where the close sits within recent trading, is at 4.5 (%K) and 9.8 (%D), also deep in oversold territory. Oversold does not mean "about to rise." It means selling has been unusually one-sided. In strong downtrends, such readings can persist for days. The MACD, a trend-following gauge built from two moving averages, sits at -22.842 against a signal line of -14.118. The histogram is -8.724, which signals negative momentum, and the code-based signal scan flags that the histogram has just turned negative.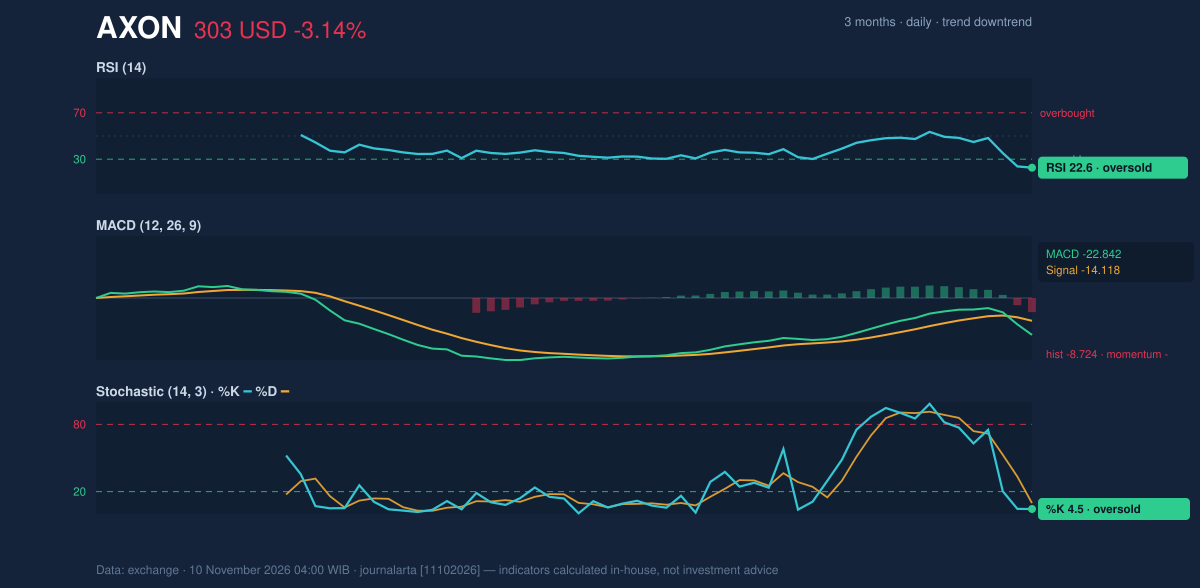
Volatility & Volume
Bollinger bands, which place a channel two standard deviations around the 20-day average, show the price below the lower band at 332.65. The %B reading of -21% confirms the close is outside the channel. Band width is 34.6% and widening, a sign of high volatility. The Average True Range (ATR), a measure of typical daily movement, is 23.96, or 7.9% of the price. A stock that routinely moves that much in a day is hard to pin down with tight levels. Volume adds weight to the move. A close below the 20-day low on volume at least 1.5 times average is one of three bearish signals flagged by the code. The others are the freshly negative MACD histogram and a downtrend confirmed by a falling On-Balance Volume (OBV), which tracks whether volume is flowing in or out of the shares. No bullish signal fired. The picture is heavy participation on the way down, not a quiet drift.What the Filings Say
The company's reported numbers point the other way. According to its SEC filing, Axon reported quarterly revenue of $908.6 million for the quarter ended September 30, 2026, up 27.8% from $710.6 million a year earlier (Form 10-Q, filed November 6). Net income was $57.0 million, compared with a net loss of $2.2 million a year earlier, and diluted earnings per share were $0.68. Axon also filed two Form 8-Ks on November 5, one covering its results of operations and one reporting a material definitive agreement and a Regulation FD disclosure. The filings summarised here do not explain the price drop, and the data does not show what drove it. The gap between growing results and a falling share price is precisely why the chart, not the earnings line, drives this assessment.Key Levels & Scenarios
The levels are conditional. If the stock closes above the 20-day resistance at 438.05, it would reclaim both moving averages and weaken the downtrend case. The 3-month high of 651.61 then becomes the far reference point. If it fails to hold support at 303.18, the next markers are the three-month low at 296.78 and then 267.24, which is the price less 1.5 times the ATR.Technical Verdict: HOLD (wait & see)
JournalArta's research model scores Axon at -79 on a scale of -100 to +100, short of the -60 threshold needed for a sell call but deep in negative territory. The call stays HOLD (wait & see) because a stop level would sit too far from the current price to define sensible risk. The strongest reasons:- Trend: the price is below the 20-day average (402.36) and the 50-day average (435.58), and the 20-day average is below the 50-day.
- Momentum: the MACD histogram of -8.724 has turned negative, though RSI of 22.6 and Stochastic %K of 4.5 show oversold conditions that can invite a bounce.
- Participation: volume of 2.4 times average on a down day, with a falling OBV.
- Upside scenario: entry zone on a close above 438.05; target 651.61 (three-month high); stop 402.36 (20-day average).
- Downside scenario: entry zone on a break of 303.18; target 267.24 (price less 1.5 times ATR); stop 339.12 (price plus 1.5 times ATR).
Summary Data AXON
| Last price | 303.18 USD |
| Change 1 day / 5 days / 1 month | -3.14% / -28.74% / -26.84% |
| Trend / MA-cross | downtrend / none |
| SMA20 / SMA50 | 402.36 / 435.58 |
| RSI (14) / Stochastic %K | 22.6 / 4.5 |
| Bollinger %B / ATR | -21% / 23.96 |
| Support / Resistance 20 days | 303.18 / 438.05 |
| Data as of | 10 November 2026 04:00 WIB |
| JournalArta research verdict (score) | Hold (-79) |
Today's full Buy and Sell list for US stocks →
Disclaimer: This technical analysis is generated automatically from exchange data and indicators calculated by JournalArta, for information and education only. The verdict and the entry, target and stop-loss levels are not investment advice or a solicitation to buy or sell any security. Investment decisions and their risks rest solely with the reader.
Track AXON stock price daily: live levels, support/resistance and our full AXON analysis history.