Cisco (CSCO) Stock Rises 5.11% on Monday, Death Cross Pressure
Technical analysis of CSCO stock on November 9, 2026: price 98.65 USD, trend downtrend, RSI 38.2, support 93.85, resistance 115.07.

Why CSCO is in focus today
- One-day move of 5.11%, about 1.3× its average daily range (ATR)
- Fresh death cross: SMA20 crossed below SMA50
- Downtrend extending (5-day change -2.91%)
Selected automatically from 100 NASDAQ (US) stocks by a technical-signal score with daily weighted randomisation — not a recommendation.
Trend & Price Action
The close sits below the 20-day average at $105.96, which in turn sits below the 50-day average at $108.59. Moving averages smooth out daily noise, so when the shorter one slips under the longer one, recent prices are consistently lower than prices from the past two months. The 20-day average fell 4.04% over five days, a sign that the downward pressure has been steady rather than a one-day wobble. The death cross formed three sessions before the latest one. It is not a signal from Monday itself. That matters because crosses are lagging indicators: they confirm a decline that has already happened rather than predicting one. The stock has fallen from a three-month high of $124.71 to a low of $93.35, and Monday's close sits at 23% of its 20-day range, closer to the bottom than the top. As shown in the chart, price is pressed against the lower half of the Bollinger Bands.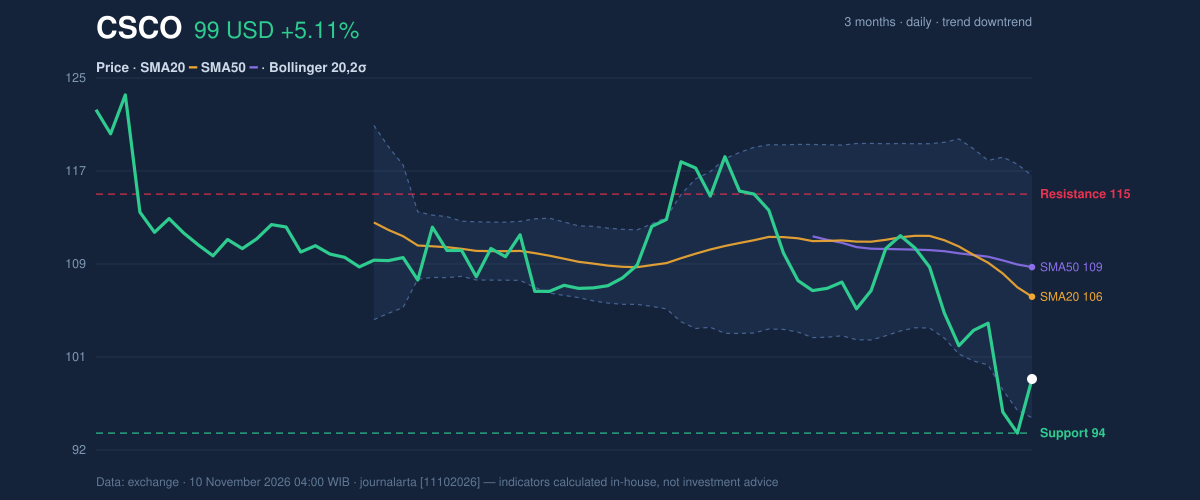
Oscillators & Momentum
Momentum gauges are weak but not at extremes. The 14-day Relative Strength Index (RSI), which scores recent gains against losses on a 0–100 scale, reads 38.2. That is neutral territory, though tilted toward the sellers. Code-computed signals list one bullish factor, RSI rebounding from below 35, which fits Monday's bounce, against two bearish ones: the fresh death cross and a downtrend confirmed by falling on-balance volume. The Stochastic oscillator, which compares the close with its recent range, shows %K at 27.4 and %D at 10.6. With %K above %D, short-term momentum has turned up from deeply depressed levels, consistent with a bounce. It does not by itself signal a change in direction. The MACD line stands at -3.394, below its signal line at -2.162, leaving a histogram of -1.232. A negative histogram means the gap between the two lines still favors sellers. Monday's jump has not yet been enough to turn it.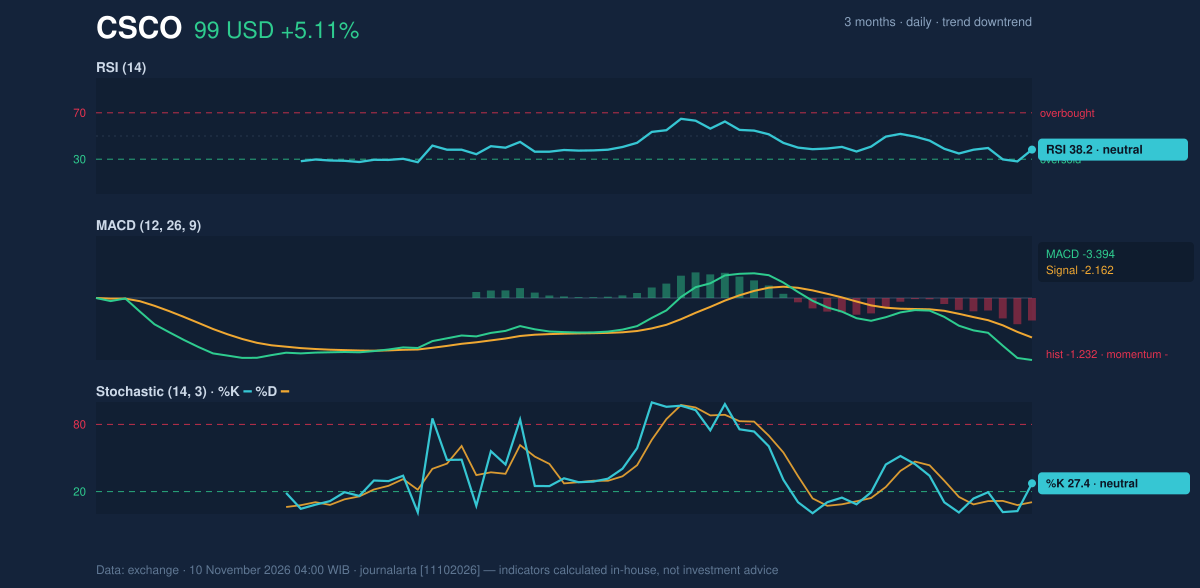
Volatility & Volume
The Bollinger Bands, drawn two standard deviations around the 20-day average, span $95.22 to $116.70. The close has a %B of 16%, meaning it sits in the bottom sixth of the band. Band width is 20.3% and widening, which signals rising volatility. The 14-day Average True Range (ATR), a measure of typical daily swing, is $3.81, or 3.9% of the price. A stock moving nearly 4% on an ordinary day can easily cross several of the levels below within a few sessions. Volume on Monday was 20,345,400 shares, about 1.1 times the 20-day average of 18,792,180. That is only modestly above normal, so the rebound was not backed by a surge in participation. On-balance volume, which adds volume on up days and subtracts it on down days, is still falling, a sign that selling pressure has outweighed buying over the period.Fundamental Context
The chart's weakness contrasts with the company's latest annual results. According to its SEC filing (Form 10-K, filed September 2, 2026), Cisco reported revenue of $63.33 billion for the fiscal year ended July 25, 2026, up 11.8% from $56.65 billion a year earlier. Net income was $13.27 billion, against $10.18 billion the year before, and diluted earnings per share were $3.33. Strong annual figures and a falling share price can coexist, since the technical picture reflects how traders are positioning now, not last year's profit.Key Levels & Scenarios
The first marker to watch is the $93.85 support and the $93.35 three-month low just beneath it. A close below both would extend the downtrend into territory not seen in three months. On the upside, the bounce needs to climb back through the lower-middle zone toward the 20-day average at $105.96 to challenge the bearish structure. The code-computed stop level at $105.13 sits just under that average.Technical Verdict: SELL
The JournalArta research model scores CSCO at -68 on a scale from -100 to +100, below the -60 threshold for a SELL call. The strongest reasons: - Death cross: the 20-day average sits below the 50-day, with the price below both. - Momentum: the MACD histogram is -1.232 and the RSI at 38.2 is in the 30–50 zone, leaving no confirmed reversal. - Volume: on-balance volume is still falling despite Monday's bounce. Levels computed by code, valid until December 8, 2026: - Entry range (sell zone): $98.65 – $101.50 - Exit target 1: $88.93 (reward/risk 1.5) - Exit target 2: $79.21 (reward/risk 3.0) - Stop loss: $105.13 The verdict is invalidated if the price closes above $105.13. Monday's 5.11% rebound is the main counter-argument: a bounce from oversold readings can stretch further than expected, and an ATR of 3.9% leaves room for sharp swings both ways. In plain terms, the chart shows the stock still trending down, and the technical model leans toward further weakness unless the price climbs back above $105.13. This is technical analysis, not an investment recommendation.| Indicator | Value |
|---|---|
| Last price (Nov 9, 2026) | $98.65 |
| 1-day / 5-day / 1-month change | 5.11% / -2.91% / -14.47% |
| SMA20 / SMA50 | $105.96 / $108.59 |
| Bollinger (upper / middle / lower) | $116.70 / $105.96 / $95.22 |
| RSI(14) | 38.2 |
| Stochastic %K / %D | 27.4 / 10.6 |
| MACD / signal / histogram | -3.394 / -2.162 / -1.232 |
| ATR(14) | $3.81 (3.9%) |
| 20-day support / resistance | $93.85 / $115.07 |
| 3-month high / low | $124.71 / $93.35 |
| Sell zone / targets / stop | $98.65–$101.50 / $88.93, $79.21 / $105.13 |
Summary Data CSCO
| Last price | 98.65 USD |
| Change 1 day / 5 days / 1 month | 5.11% / -2.91% / -14.47% |
| Trend / MA-cross | downtrend / death |
| SMA20 / SMA50 | 105.96 / 108.59 |
| RSI (14) / Stochastic %K | 38.2 / 27.4 |
| Bollinger %B / ATR | 16% / 3.81 |
| Support / Resistance 20 days | 93.85 / 115.07 |
| Data as of | 10 November 2026 04:00 WIB |
| JournalArta research verdict (score) | Sell (-68) |
| Sell zone | 98.65 – 101.50 |
| Target 1 / 2 | 88.93 / 79.21 |
| Stop loss | 105.13 |
| Reward/risk | 1.5 / 3.0 |
Today's full Buy and Sell list for US stocks →
Disclaimer: This technical analysis is generated automatically from exchange data and indicators calculated by JournalArta, for information and education only. The verdict and the entry, target and stop-loss levels are not investment advice or a solicitation to buy or sell any security. Investment decisions and their risks rest solely with the reader.
Track CSCO stock price daily: live levels, support/resistance and our full CSCO analysis history.