Advanced Micro Devices (AMD) Stock Technicals: Rises 13.26% on Monday, Death Cross Pressure
Technical analysis of AMD stock on November 9, 2026: price 508.58 USD, trend downtrend, RSI 47.7, support 404.40, resistance 605.53.

Why AMD is in focus today
- One-day move of 13.26%, about 1.6× its average daily range (ATR)
- Volume at 1.7× the 20-day average
- Fresh death cross: SMA20 crossed below SMA50
Selected automatically from 100 NASDAQ (US) stocks by a technical-signal score with daily weighted randomisation — not a recommendation.
Trend & Price Action
The broader picture is still a downtrend. The price sits below the 20-day simple moving average (SMA20) at 523.01 and below the 50-day average at 547.67. The 20-day average has itself fallen 6.97% over five days, which shows how quickly the recent average price has been sliding. A death cross formed three sessions before the latest one, when the 20-day average crossed below the 50-day. Traders read this as a sign that short-term momentum has weakened relative to the longer-term trend. It is a lagging signal, confirming a decline already under way rather than predicting a new one. As shown in the chart below, the price has pushed back toward the 20-day average from underneath. In a downtrend, that kind of bounce often meets selling from holders who bought higher and want to exit near break-even.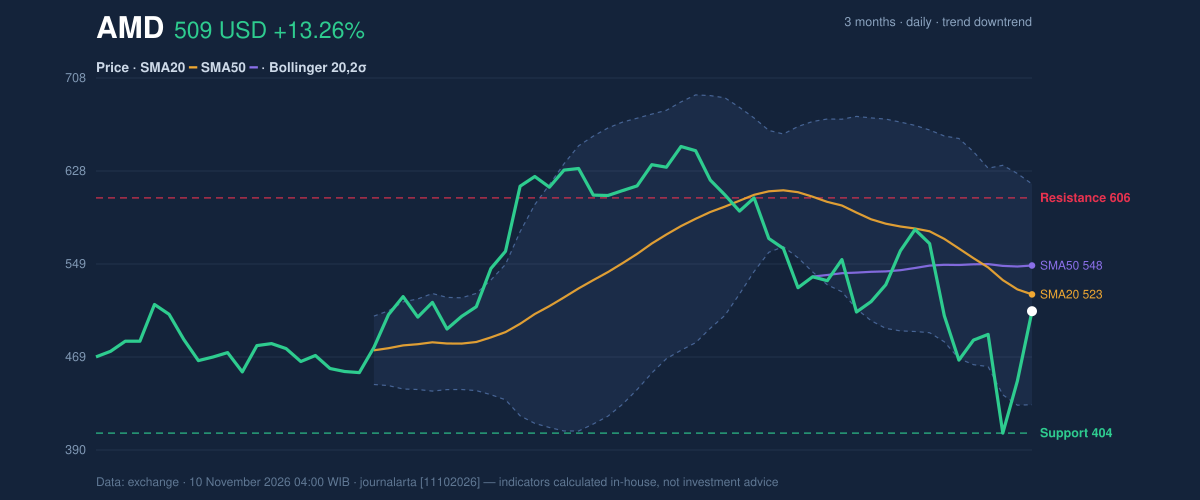
Oscillators & Momentum
Momentum indicators are mixed rather than decisive. The 14-day Relative Strength Index (RSI), which measures the pace of recent gains against losses on a 0–100 scale, reads 47.7, firmly neutral. The Stochastic oscillator, which compares the close with the recent trading range, shows %K at 60.1 and %D at 29.3. The fast line has crossed well above the slow one, a sign of a sharp short-term bounce, though both readings remain in neutral territory. The MACD, which tracks the gap between short- and long-term averages, tells a more cautious story. It stands at -26.738, below its signal line at -19.042, with a histogram of -7.697. That means negative momentum persists despite Monday's surge. In plain terms, the price has moved faster than the trend indicators can register, and they have yet to confirm a reversal.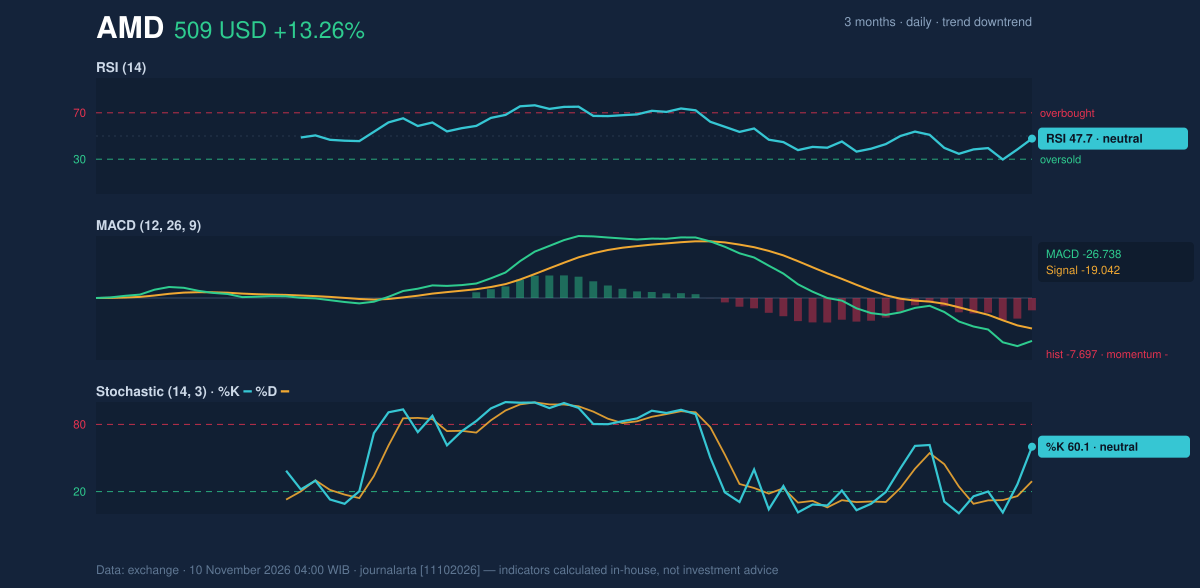
Volatility & Volume
Bollinger Bands, which draw a channel two standard deviations around the 20-day average, span 428.65 to 617.38. The band width of 36.1% is widening, a sign of high volatility. The price's %B reading of 42% puts it just under the middle of the channel. ATR is 41.07, about 8.1% of the price, so daily swings of this size should be considered normal for AMD at present. Volume offers a partial counterweight to the bearish structure. On-balance volume (OBV), a running tally that adds volume on up days and subtracts it on down days, is rising. Heavy trading on a strong up day suggests real participation in the bounce, though one session does not make a trend.Fundamental Context
The financial backdrop is strong. According to its SEC filing (Form 10-Q, filed November 4, 2026), AMD reported quarterly revenue of $13.38 billion for the quarter ended September 26, up 44.7% from $9.25 billion a year earlier. Net income was $2.43 billion, against $1.24 billion a year before, with diluted earnings per share of $1.46. The company also filed a Form 8-K on November 3 covering its results of operations and a Regulation FD disclosure. Strong earnings alongside a falling share price indicate that the market's concern lies elsewhere than in reported results.Key Levels & Scenarios
The JournalArta research score is -53 on a scale from -100 to +100, short of the -60 threshold that triggers a sell call and well below the +60 needed for a buy. Technical signals tilt bearish, two against one, which is consistent with that reading.Technical Verdict: HOLD (wait & see)
HOLD (wait & see) reflects trend and momentum that are not yet aligned. The strongest reasons: - Trend: the price is below both the SMA20 and SMA50, and the recent death cross confirms the downtrend. - Momentum: MACD remains negative at -26.738 even as RSI (47.7) is neutral. - Participation: volume at 1.7 times average and rising OBV support the bounce, which is why the call is not outright bearish. Conditional scenarios, drawn only from the reference levels: - Upside scenario: a close above the 20-day resistance at 605.53 would be needed to challenge the downtrend. The price + 1.5×ATR level of 570.18 is an intermediate marker on the way. - Downside scenario: a break of the 20-day support at 404.40 would open the path toward the three-month low of 402.10. The price − 1.5×ATR level of 446.98 marks an earlier warning zone. - Invalidation: the neutral stance would be invalidated if the price breaks below 404.40. For non-traders: AMD had a big up day, but the longer-term chart still points down, so the signals say to wait for clearer confirmation. This is technical analysis, not an investment recommendation. | Indicator | Value | |---|---| | Last price | $508.58 | | 1-day / 5-day / 1-month change | 13.26% / 8.94% / -14.42% | | SMA20 / SMA50 | 523.01 / 547.67 | | RSI(14) | 47.7 | | Stochastic %K / %D | 60.1 / 29.3 | | MACD / signal | -26.738 / -19.042 | | Bollinger (upper / mid / lower) | 617.38 / 523.01 / 428.65 | | ATR(14) | 41.07 | | 20-day support / resistance | 404.40 / 605.53 | | Volume vs 20-day average | 1.7× |Summary Data AMD
| Last price | 508.58 USD |
| Change 1 day / 5 days / 1 month | 13.26% / 8.94% / -14.42% |
| Trend / MA-cross | downtrend / death |
| SMA20 / SMA50 | 523.01 / 547.67 |
| RSI (14) / Stochastic %K | 47.7 / 60.1 |
| Bollinger %B / ATR | 42% / 41.07 |
| Support / Resistance 20 days | 404.40 / 605.53 |
| Data as of | 10 November 2026 04:00 WIB |
| JournalArta research verdict (score) | Hold (-53) |
Today's full Buy and Sell list for US stocks →
Disclaimer: This technical analysis is generated automatically from exchange data and indicators calculated by JournalArta, for information and education only. The verdict and the entry, target and stop-loss levels are not investment advice or a solicitation to buy or sell any security. Investment decisions and their risks rest solely with the reader.
Track AMD stock price daily: live levels, support/resistance and our full AMD analysis history.