Starbucks (SBUX) Stock Rises 3.82% on Monday, Golden Cross Formed
Technical analysis of SBUX stock on November 9, 2026: price 109.44 USD, trend uptrend, RSI 66.9, support 92.00, resistance 109.70.
Starbucks shares closed at $109.44 on Monday, November 9, 2026, on the Nasdaq, up 3.82% from a prior close of $105.41. The stock is now 1.8% below its three-month high of $111.50. That is a long way from where the coffee chain stood a month ago: the shares have gained 18.58% over one month and 4.83% over five days.
Why SBUX is in focus today
- One-day move of 3.82%, about 1.3× its average daily range (ATR)
- Trading near its 3-month high (111.50)
- Fresh golden cross: SMA20 crossed above SMA50
- Uptrend confirmed (5-day change 4.83%)
Selected automatically from 100 NASDAQ (US) stocks by a technical-signal score with daily weighted randomisation — not a recommendation.
The jump was about 1.3 times the stock's average daily range, so it was large but not unusual. What makes the session notable is what it did to the chart: a golden cross, a three-month-high test and a rising on-balance volume line all line up on one side.
Trend & Price Action
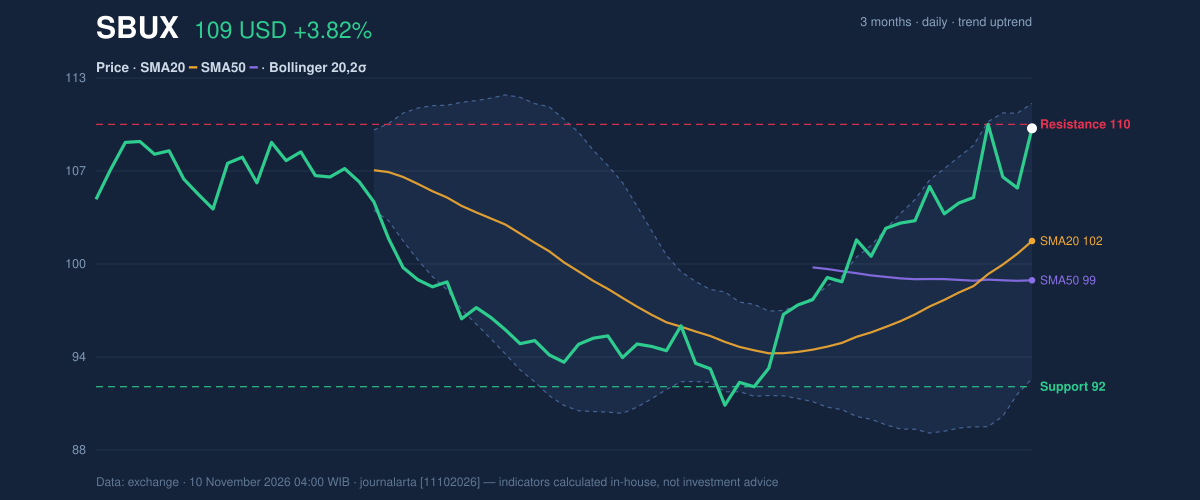
A golden cross is a bullish pattern in which the short-term moving average climbs through the longer-term one. Here the 20-day simple moving average (SMA20) crossed above the 50-day (SMA50). The cross formed three sessions before the latest session, so it is recent but not brand new. The SMA20 sits at $101.83 and the SMA50 at $99.18, with the price well above both.
The 20-day average rose 3.54% over five days. That figure describes the average itself, not the share price, but it shows the recent buying has been persistent rather than a single spike.
As shown in the chart below, the price has pushed to the top of its short-term range. The 20-day resistance is $109.70, and the close of $109.44 sits at 99% of the range between support at $92.00 and that ceiling.
[GRAFIK-PRICE-PLACEHOLDER]Oscillators & Momentum
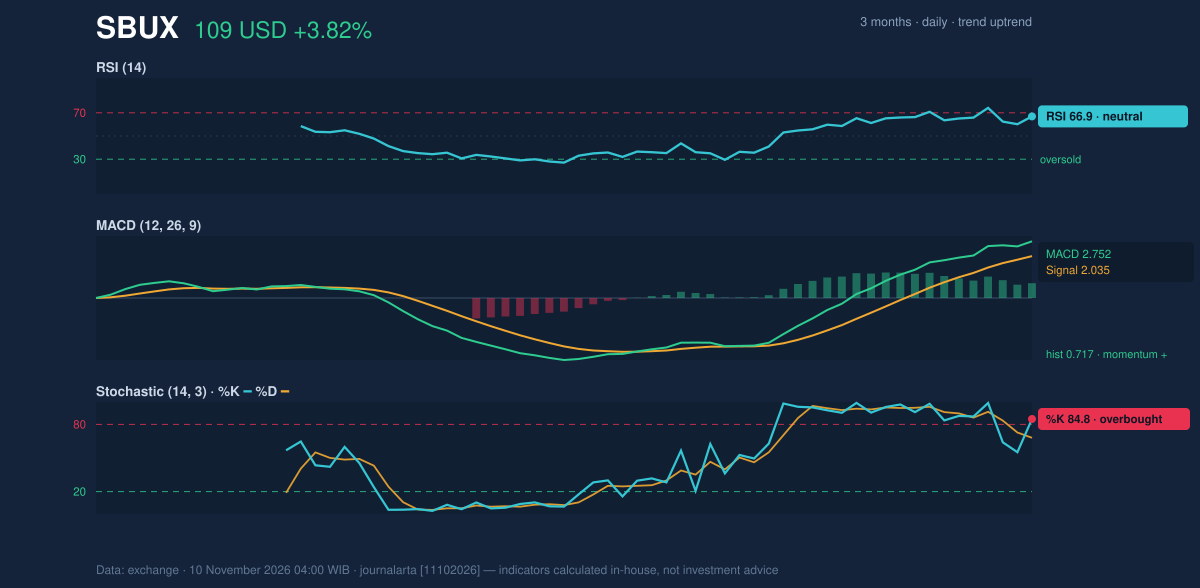
Momentum is strong but stretched. The 14-day Relative Strength Index (RSI), which measures how fast prices have risen against how fast they have fallen, reads 66.9. That is classed as neutral, below the 70 line that usually flags overheating.
The Stochastic oscillator is less forgiving. Its %K line is at 84.8 against a %D of 68.0, which puts it in overbought territory. Put simply, the close is near the top of its recent range, and short rallies from such levels often pause.
The MACD, a trend-following gauge built from two moving averages, is at 2.752 against a signal line of 2.035. The histogram of 0.717 is positive, so buying momentum is still widening rather than fading. The three tools disagree on how much room is left: MACD says the push continues, the Stochastic says it is crowded.
Volatility & Volume
Bollinger Bands wrap a price in a channel two standard deviations either side of its 20-day average. The upper band is at $111.12, the middle at $101.83 and the lower at $92.55. The %B reading of 91% means the stock is trading near the upper edge, though the band width of 18.2% is normal, not stretched.
The Average True Range (ATR), a measure of typical daily movement, is $3.13, or 2.9% of the price. That points to moderate volatility: a move of a few dollars in either direction is routine for this stock.
Volume was ordinary. About 8.91 million shares changed hands, against a 20-day average of 8.99 million, or 1.0 times normal. Volume did not surge on the rally, but the on-balance volume line, which tallies volume on up days against down days, is rising. That suggests buyers have outweighed sellers over the period.
Fundamental Context
According to its SEC filing, Starbucks reported quarterly revenue of $9.32 billion for the quarter ended June 28, 2026, down 1.4% from $9.46 billion a year earlier (Form 10-Q, filed July 29). Net income was $1.05 billion, compared with $558.3 million a year earlier, and diluted earnings per share were $0.91. Revenue slipped while profit nearly doubled. The company also filed a Form 8-K on October 29 reporting its results of operations and financial condition.
Key Levels & Scenarios
The nearest ceiling is the 20-day resistance at $109.70, which the stock is testing, with the three-month high of $111.50 and the upper Bollinger Band at $111.12 just above. A sustained break through that cluster would put the stock in open air. If the stock fails to hold, the $101.83 mid-band and SMA20 is the first area where the recent advance could be tested, and 20-day support at $92.00 is the floor of the broader range.
Technical Verdict: BUY
JournalArta's research model, computed by code, rates SBUX BUY with a score of +76 on a scale of -100 to +100 (BUY at +60 or above). The strongest reasons:
- Golden cross: the SMA20 at $101.83 is above the SMA50 at $99.18, and the price is above both.
- Volume confirmation: on-balance volume is rising, with two bullish technical signals against none bearish.
- MACD: the histogram is positive at 0.717, showing momentum still building, although the Stochastic at 84.8 is overbought.
The levels for this call, valid until December 8, 2026:
- Entry range: $107.10 – $109.44
- Exit target 1: $117.43 (reward/risk 1.5)
- Exit target 2: $125.43 (reward/risk 3.0)
- Stop loss: $104.11
The verdict is invalidated if the price falls below $104.11. In plain terms: the chart currently shows buyers in control of Starbucks, though the stock is already near the top of its recent range. This is technical analysis, not investment advice.
| Indicator | Value |
|---|---|
| Last price (Nov 9, 2026) | $109.44 |
| Change: 1 day / 5 days / 1 month | 3.82% / 4.83% / 18.58% |
| SMA20 / SMA50 | $101.83 / $99.18 |
| Bollinger (upper / middle / lower) | $111.12 / $101.83 / $92.55 |
| RSI(14) | 66.9 |
| Stochastic %K / %D | 84.8 / 68.0 |
| MACD / signal / histogram | 2.752 / 2.035 / 0.717 |
| ATR(14) | 3.13 (2.9%) |
| 20-day support / resistance | $92.00 / $109.70 |
| 3-month low / high | $87.35 / $111.50 |
| Volume vs 20-day average | 8,913,300 vs 8,994,960 (1.0x) |
Starbucks' next filing date has not been set in the data reviewed here, but the model's levels remain valid through December 8, 2026.
Summary Data SBUX
| Last price | 109.44 USD |
| Change 1 day / 5 days / 1 month | 3.82% / 4.83% / 18.58% |
| Trend / MA-cross | uptrend / golden |
| SMA20 / SMA50 | 101.83 / 99.18 |
| RSI (14) / Stochastic %K | 66.9 / 84.8 |
| Bollinger %B / ATR | 91% / 3.13 |
| Support / Resistance 20 days | 92.00 / 109.70 |
| Data as of | 10 November 2026 04:00 WIB |
| JournalArta research verdict (score) | Buy (+76) |
| Entry zone | 107.10 – 109.44 |
| Target 1 / 2 | 117.43 / 125.43 |
| Stop loss | 104.11 |
| Reward/risk | 1.5 / 3.0 |
Today's full Buy and Sell list for US stocks →
Disclaimer: This technical analysis is generated automatically from exchange data and indicators calculated by JournalArta, for information and education only. The verdict and the entry, target and stop-loss levels are not investment advice or a solicitation to buy or sell any security. Investment decisions and their risks rest solely with the reader.
Track SBUX stock price daily: live levels, support/resistance and our full SBUX analysis history.