Coca-Cola (KO) Stock Technicals: Rises 0.38% on Monday, Testing Key Resistance
Technical analysis of KO stock on November 9, 2026: price 96.03 USD, trend uptrend, RSI 65.4, support 90.11, resistance 96.03.
Coca-Cola (NYSE: KO) closed at $96.03 on Monday, November 9, 2026, its highest finish in 20 trading days and within $1.36 of its three-month peak of $97.39. The beverage giant gained 0.38% on the day, 0.21% over five days and 6.95% over the past month. That combination of a steady climb and a stock pressing against its recent ceiling is why it stands out on today's screen.
Why KO is in focus today
- Closed at a 20-day high (96.03)
- Trading near its 3-month high (97.39)
Selected automatically from 80 NYSE (US) stocks by a technical-signal score with daily weighted randomisation — not a recommendation.
Trend & Price Action
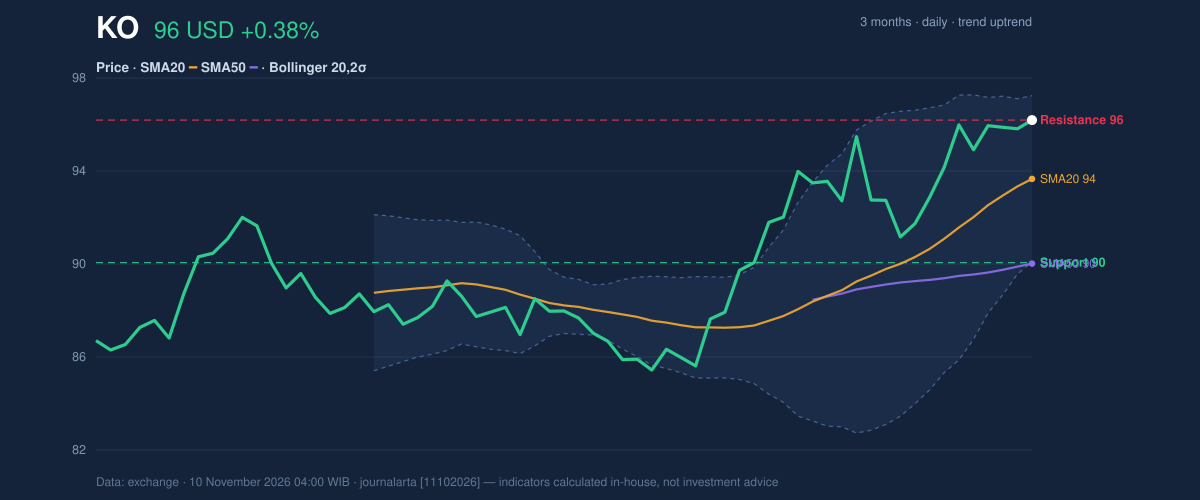
The structure is clean. Price sits above both the 20-day average ($93.59) and the 50-day average ($90.07), and the 20-day line sits above the 50-day, the arrangement technicians read as an established uptrend. There was no new moving-average crossover. The 20-day average rose 2.21% over five days, which tells us the trend's backbone is still tilting upward rather than flattening.
The stock has also closed at the top of its 20-day range: support at $90.11, resistance at $96.03, and the last price sits exactly on that upper edge. As shown in the chart, the climb has been orderly, with price hugging the rising 20-day line rather than spiking away from it.
[GRAFIK-PRICE-PLACEHOLDER]Closing at a range high is a double-edged signal. It shows buyers are in control. It also means the stock now has to prove it can hold new ground, because the next real test is the three-month high at $97.39.
Oscillators & Momentum
Momentum supports the trend without screaming excess. The 14-day RSI reads 65.4, which is neutral: strong, but short of the 70 level that usually flags an overheated market. The MACD line, which tracks the gap between short- and long-term averages, stands at 1.721 against a signal line of 1.548. The histogram of 0.174 is positive, meaning upward momentum is still building rather than fading.
The Stochastic oscillator is the cautionary note. Its %K of 80.0 and %D of 76.8 are in overbought territory, which means the stock is closing near the top of its recent range. In a trending market that can persist for weeks. But it does raise the odds of a brief pause or pullback.
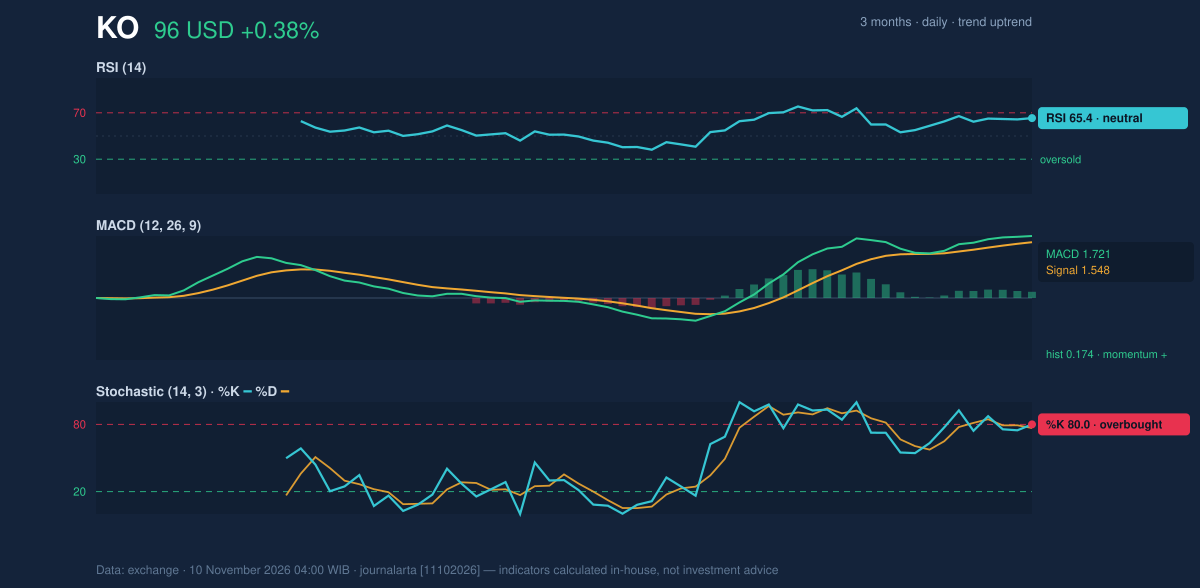
The takeaway: RSI and MACD say the trend has room, while Stochastic says the short-term move is stretched. Those readings can coexist, and they often do in the middle of a healthy advance.
Volatility & Volume
Bollinger Bands, which draw a range two standard deviations around the 20-day average, have narrowed to a width of 7.4%. The upper band is at $97.05, the middle at $93.59 and the lower at $90.13. Price sits at 85% of the band (%B), near the top. A narrowing band is called a squeeze: volatility has been compressed, and such periods often precede a larger move, though the squeeze itself does not say which direction.
The Average True Range, a measure of typical daily swing, is $1.96, or 2.0% of price. That is moderate volatility. A stock moving about 2% a day can cover the distance to the next resistance in a few sessions.
Volume offers mixed participation. Monday's 16.64 million shares were 0.9 times the 20-day average of 18.72 million, slightly light for a range-high close. On-balance volume, which adds volume on up days and subtracts it on down days, is rising, so the longer-run flow still favors buyers.
Fundamental Context
The technical picture sits on solid reported numbers. According to its SEC filing (Form 10-Q, filed October 28, 2026), Coca-Cola reported quarterly revenue of $13.38 billion for the quarter ended October 2, up 7.4% from $12.46 billion a year earlier. Net income was $4.01 billion versus $3.70 billion a year earlier, with diluted earnings per share of $0.93. The company also filed a Form 8-K on October 27 reporting its results of operations and financial condition.
Key Levels & Scenarios
The levels that matter are close together. Support lies at $90.11, with the 20-day average at $93.59 acting as the first cushion on any dip. On the upside, the 20-day high of $96.03 has just been matched, and the three-month high of $97.39 is the next barrier, just above the upper Bollinger Band at $97.05.
If the stock holds above its 20-day average and pushes through $97.39, the squeeze would resolve upward. If it slips back below the 20-day line, the focus shifts to the 50-day average and the $90 area.
Technical Verdict: BUY
JournalArta's research model scores KO at +76 on a scale of −100 to +100, above the +60 threshold for a BUY call. The strongest reasons:
- Trend structure: price is above the 50-day average, the 20-day average is above the 50-day, and the trend is up.
- Pullback signal: two bullish technical signals against zero bearish, including a pullback to the 20-day average within an uptrend.
- Volume confirmation: rising OBV supports the uptrend, and the MACD histogram remains positive.
The overbought Stochastic (80.0) and the lighter-than-average volume are the main risks. The verdict is invalidated if price falls below $92.69.
- Entry range: $94.57 – $96.03
- Exit target 1: $101.04 (reward/risk 1.5)
- Exit target 2: $106.05 (reward/risk 3.0)
- Stop loss: $92.69
These levels are valid until December 8, 2026. This is technical analysis, not an investment recommendation. In plain terms: the chart for Coca-Cola leans positive, with a stretched short-term reading that could bring a brief pause before any further rise.
Coca-Cola's next scheduled test is the $97.39 three-month high, a line the stock has not crossed since it began this month's climb.
Summary Data KO
| Last price | 96.03 USD |
| Change 1 day / 5 days / 1 month | 0.38% / 0.21% / 6.95% |
| Trend / MA-cross | uptrend / none |
| SMA20 / SMA50 | 93.59 / 90.07 |
| RSI (14) / Stochastic %K | 65.4 / 80.0 |
| Bollinger %B / ATR | 85% / 1.96 |
| Support / Resistance 20 days | 90.11 / 96.03 |
| Data as of | 10 November 2026 04:00 WIB |
| JournalArta research verdict (score) | Buy (+76) |
| Entry zone | 94.57 – 96.03 |
| Target 1 / 2 | 101.04 / 106.05 |
| Stop loss | 92.69 |
| Reward/risk | 1.5 / 3.0 |
Today's full Buy and Sell list for US stocks →
Disclaimer: This technical analysis is generated automatically from exchange data and indicators calculated by JournalArta, for information and education only. The verdict and the entry, target and stop-loss levels are not investment advice or a solicitation to buy or sell any security. Investment decisions and their risks rest solely with the reader.
Track KO stock price daily: live levels, support/resistance and our full KO analysis history.