AT&T (T) Stock Technicals: Rises 0.79% on Monday, Momentum Gains
Technical analysis of T stock on November 9, 2026: price 21.80 USD, trend downtrend, RSI 43.3, support 20.70, resistance 23.50.
By matthew jonathan
November 10, 20262 min read
Advertisement
Logo AT&T — JournalArta illustration
AT&T shares closed at $21.80 on Monday, November 9, 2026, up 0.79% on the day from a prior close of $21.63. The one-day gain is small, but it extends a five-day rise of 1.68% that still leaves the stock down 3.07% over one month. JournalArta has not covered the stock in the past 14 days, and the pattern is worth a look: a bounce is running into a falling average, with the price still the weaker party.
Trend and Price Action
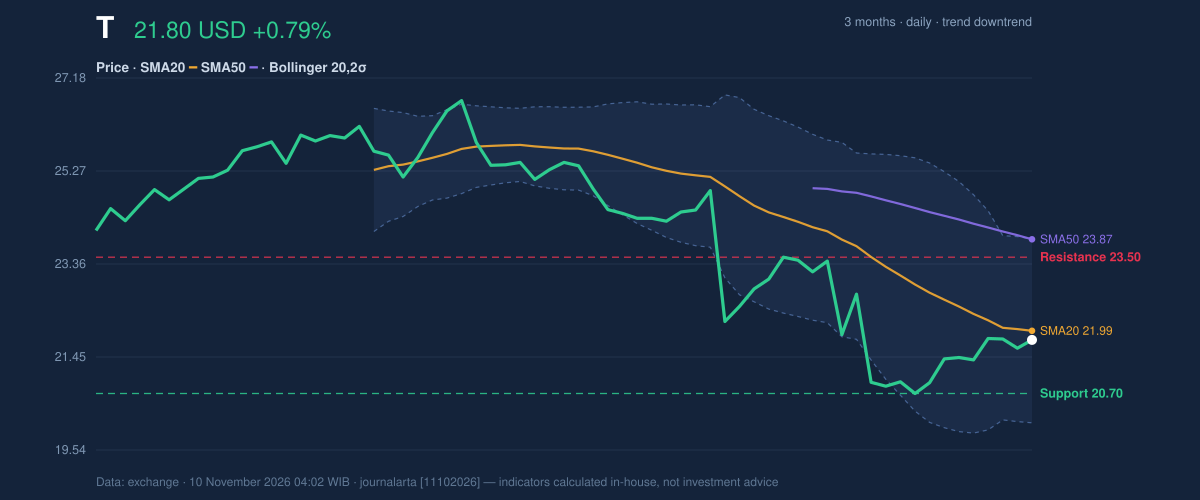
The primary trend is down. The stock sits below its 20-day simple moving average (SMA20) at $21.99, and both sit under the 50-day average at $23.87. That ordering, price under the short average and the short average under the long one, is the standard signature of a stock in decline. No new moving-average crossover has formed. The 20-day average itself fell 2.22% over the past five days, so the benchmark the price is chasing keeps moving away from it.
Put simply, the recent gain is a rebound inside a downtrend, not a reversal. Price is now just 19 cents below the SMA20, which makes that line the first test. Stocks in downtrends often stall at a falling average, as sellers who were underwater tend to use such rallies to exit.
3-month price action chart of T: price, SMA20/50, Bollinger, support & resistance.
Advertisement
As shown in the chart, the 20-day range runs from support at $20.70 to resistance at $23.50, and the stock trades at 39% of that span. The three-month high is $26.93 and the low is $20.52, so the shares sit much closer to the bottom of their quarterly range than the top. The 3-month low is only about 18 cents below the 20-day support, which gives the $20.52 to $20.70 zone extra weight as a floor.
Oscillators and Momentum
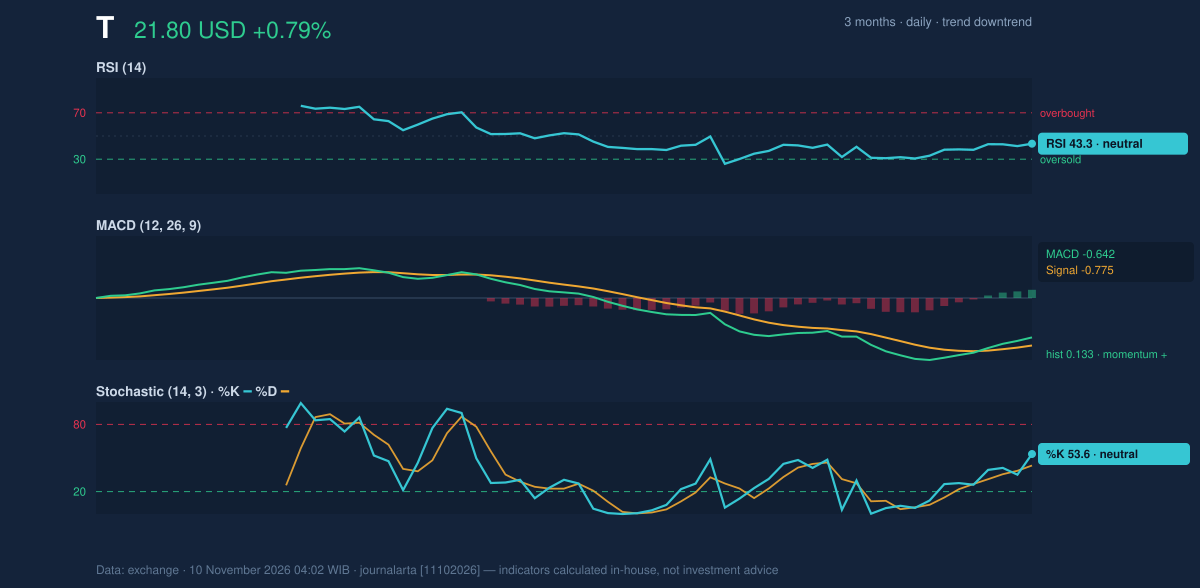
Momentum gauges are lukewarm, not decisive. The relative strength index (RSI), which measures the speed of recent gains against losses on a 0–100 scale, reads 43.3. That is neutral, though on the weak side of the midline. The Stochastic oscillator shows %K at 53.6 against %D at 43.3, also neutral. The faster line sitting above the slower one signals a short-term upturn, but at these levels it carries no overbought or oversold message.
The MACD, a trend-following gauge built from two moving averages, is at -0.642 against a signal line of -0.775. The histogram of 0.133 is positive, meaning downward momentum is easing. But the MACD line remains below zero, which confirms the longer slide is not over. Easing pressure and a reversal are different things.
Momentum chart of T: RSI(14), MACD, Stochastic.
Advertisement
The takeaway from the chart: short-term indicators are improving while the structural indicators stay bearish. Trend and momentum are not aligned, and that disagreement is the story here.
Volatility and Volume
45%, just below mid-channel. There is no squeeze that would hint at an imminent breakout, and no stretch that would suggest exhaustion.
The average true range (ATR), a measure of typical daily movement, is $0.74, or 3.4% of the price. That is moderate volatility: a move of about 74 cents in either direction on a given day would not be unusual.
Volume deserves a caveat. Monday's turnover was 42.1 million shares, or 0.8 times the 20-day average of 52.4 million. A rally on below-average volume suggests limited conviction. Still, on-balance volume (OBV), which tallies volume on up days against down days, is rising, a mild sign that buying has outweighed selling over the recent stretch.
Fundamental Context
According to its SEC filing, AT&T reported quarterly revenue of $32.32 billion for the quarter ended September 30, 2026, up 5.3% from $30.71 billion a year earlier (Form 10-Q filed October 21). Net income was $891.0 million, compared with $9.31 billion a year earlier, and diluted earnings per share were $0.12. The filing shows revenue growing while profit fell sharply from the year-earlier figure, a mix that helps explain why the market has not rewarded the shares.
Advertisement
Technical Verdict: HOLD (wait & see)
JournalArta's research model scores the stock at -58 on a scale of −100 to +100, short of the −60 threshold for a sell call and far from the +60 needed for a buy. The call is HOLD (wait & see), for three reasons:
- The price is below its 50-day average, the 20-day average is below the 50-day, and the trend is down.
- RSI at 43.3 and the Stochastic are neutral, so momentum offers no clear signal either way.
- The code finds zero bullish and one bearish technical signal: a bounce into the SMA20 within a downtrend.
The levels below are conditional scenarios drawn from reference levels, not recommendations:
- Upside scenario, entry range: a daily close above 20-day resistance at $23.50.
- Upside scenario, exit target: the 3-month high of $26.93, with the price plus 1.5× ATR level of $22.92 as an early checkpoint.
- Upside scenario, stop loss: a close back below the SMA20 at $21.99.
- Downside scenario: a break below 20-day support at $20.70, with the 3-month low of $20.52 as the next marker. The price minus 1.5× ATR level is $20.68.
The verdict is invalidated if the price closes below $20.70 (turning it bearish) or above $23.50 (turning it constructive).
In plain terms: AT&T is bouncing, but the bounce has not yet changed the direction of the trend, so the data argue for patience, not action.
This is technical analysis, not an investment recommendation.
Disclaimer: This technical analysis is generated automatically from exchange data and indicators calculated by JournalArta, for information and education only. The verdict and the entry, target and stop-loss levels are not investment advice or a solicitation to buy or sell any security. Investment decisions and their risks rest solely with the reader.