Vodafone Share Price Falls 1.03%, Testing Support Level In Focus
Technical analysis of Vodafone stock on November 10, 2026: price 115.75 GBp, trend downtrend, RSI 41.3, support 115.75, resistance 122.05.

Why Vodafone is in focus today
- Volume at 1.6× the 20-day average
- Closed at a 20-day low (115.75)
- Trading near its 3-month low (114.30)
- MACD histogram has just turned negative
- Downtrend extending (5-day change -1.24%)
Selected automatically from 98 LSE (UK) stocks by a technical-signal score with daily weighted randomisation — not a recommendation.
Trend & Price Action
Vodafone closed below both its 20-day simple moving average (SMA) of 118.54 and its 50-day average of 122.71. The shorter average is itself falling, down 0.63% over five days, and there has been no new moving-average crossover. Together, those readings describe a downtrend rather than a confirmed turn: the share price remains below its short-term trend line, with the longer average higher still. At 115.75, the price sat at the bottom of its 20-day range and close to the three-month low of 114.30; the three-month high is 132.07. The stock is therefore vulnerable to a further test of its recent floor, even as proximity to that floor could prompt short-term buying. The 20-day support is 115.75, while the 20-day resistance is 122.05.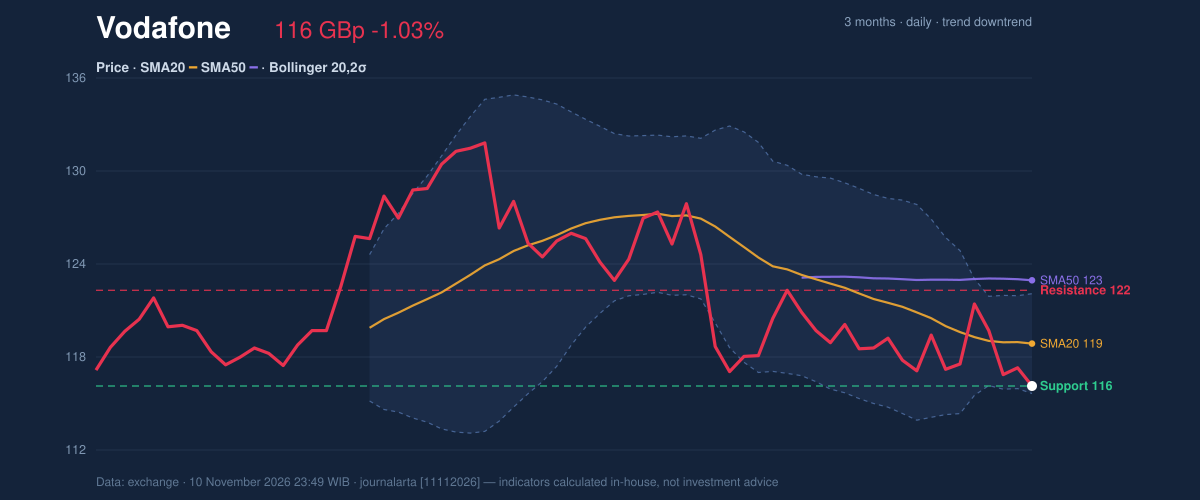
Oscillators & Momentum
The indicators show weakness, but not an unambiguous oversold reversal. The RSI is 41.3, a neutral reading, below the midpoint often used to distinguish stronger from weaker momentum. The Stochastic is oversold, with %K at 17.4 and %D at 25.1. Oversold conditions can precede a rebound, but they do not establish that one has begun. The MACD histogram has turned negative at -0.045, with MACD at -1.379 below its -1.334 signal line. That points to weakening momentum and is one reason the decline matters despite the oversold Stochastic reading. The signals are not fully aligned: Stochastic suggests the fall may be stretched, while MACD still confirms negative pressure.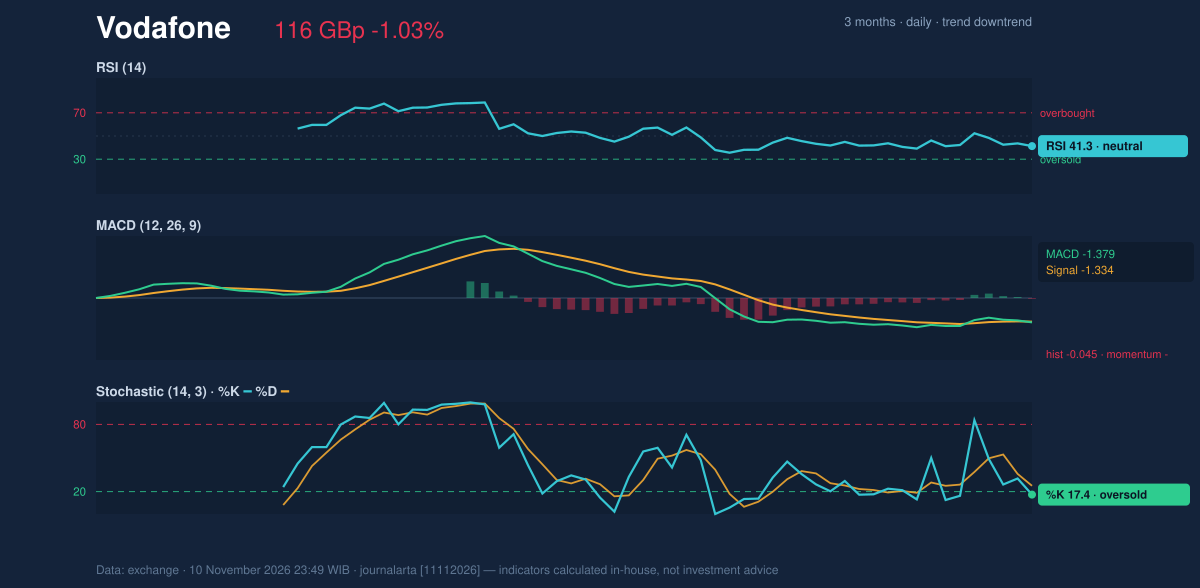
Volatility, Volume & Levels
Vodafone’s price is near the lower Bollinger Band at 115.26. Its %B reading of 8% places it close to that band, while the band width has narrowed to 5.5%. A narrowing band, or squeeze, indicates subdued recent price variation and can precede a larger move, but does not indicate its direction. The ATR is 2.84, or 2.5% of the share price, consistent with moderate volatility. The volume jump to 1.6 times its 20-day average strengthens the significance of the weak close. OBV rising complicates the picture, suggesting volume accumulation has not tracked price lower in the same way. If the shares fall below 115.75, the three-month low of 114.30 becomes the next visible reference in the supplied data; a hold above support could allow a test of 122.05 resistance. A move through that resistance would still need to contend with the 20-day average at 118.54 and the 50-day average at 122.71.Technical Verdict: SELL
JournalArta Research’s technical verdict is SELL, with a score of -89 on a scale from -100 to +100. The case rests on three bearish signals and no bullish signals: the close below the 20-day low on volume of at least 1.5 times average, the MACD histogram’s turn negative, and a bounce into the 20-day average during a downtrend while price remains below the 50-day average. The falling 20-day average adds evidence that the near-term trend remains weak. The verdict is invalidated if the price rises through the 122.62 stop-loss level. - Entry range: 115.75–117.87 GBp - Exit targets: 105.45 GBp (target one) and 95.14 GBp (target two) - Stop-loss protection: 122.62 GBp In plain English, the indicators currently point to continued downside risk, though a move above the specified stop level would invalidate this reading.| Metric | Reading |
|---|---|
| Last price | 115.75 GBp |
| One-day / five-day / one-month change | -1.03% / -1.24% / -1.66% |
| SMA20 / SMA50 | 118.54 / 122.71 |
| Support / resistance (20 trading days) | 115.75 / 122.05 |
| Three-month high / low | 132.07 / 114.30 |
| Verdict validity | Until December 8, 2026 |
Summary Data Vodafone
| Last price | 115.75 GBp |
| Change 1 day / 5 days / 1 month | -1.03% / -1.24% / -1.66% |
| Trend / MA-cross | downtrend / none |
| SMA20 / SMA50 | 118.54 / 122.71 |
| RSI (14) / Stochastic %K | 41.3 / 17.4 |
| Bollinger %B / ATR | 8% / 2.84 |
| Support / Resistance 20 days | 115.75 / 122.05 |
| Data as of | 10 November 2026 23:49 WIB |
| JournalArta research verdict (score) | Sell (-89) |
| Sell zone | 115.75 – 117.87 |
| Target 1 / 2 | 105.45 / 95.14 |
| Stop loss | 122.62 |
| Reward/risk | 1.5 / 3.0 |
Today's full Buy and Sell list for UK, Singapore & Hong Kong stocks →
Disclaimer: This technical analysis is generated automatically from exchange data and indicators calculated by JournalArta, for information and education only. The verdict and the entry, target and stop-loss levels are not investment advice or a solicitation to buy or sell any security. Investment decisions and their risks rest solely with the reader.
Track Vodafone share price daily: live levels, support/resistance and our full Vodafone analysis history.