Momentum Weakens, Shell Stock Gains 0.21% Today
On Oktober 5, 2026: price 3,596.50 GBp, trend uptrend, RSI 58.3, support 3,482.50, resistance 3,654.50. technical analysis of shell stock.

Shell plc rose on the London Stock Exchange on 2 October 2026, with the shares last changing hands at 3,596.50 GBp, a modest 0.21% gain on the day after a recent run that has left the stock 4.64% higher over one month. The move keeps Shell in an uptrend, but the chart is sending a more nuanced message: price is holding above the short-term average, while momentum is no longer accelerating with the same force.
Trend & Price Action
The key structural point is that Shell is trading above its SMA20 at 3,566.30 and well above its SMA50 at 3,437.90, which tells traders the medium-term trend still leans upward. The fact that the SMA20 slope is rising by 1.30% over 5 days matters: it shows the recent advance has not just been a one-day bounce, but a short sequence of higher closes supporting the trend.
That said, the stock is not breaking away from its range. It sits at about 66% of the 20-hour range, with support at 3,482.50 and resistance at 3,654.50, so the market is still working inside a fairly defined band. As shown in the chart, Shell is also below the 3,668.38 upper Bollinger Band, which means the shares are not yet in a stretched condition; they are advancing, but not overheating.
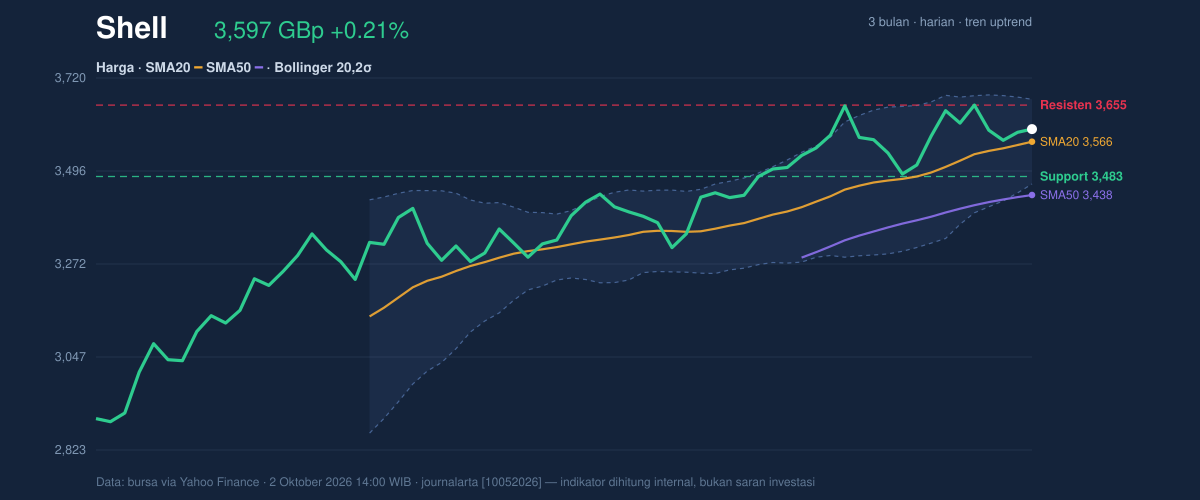
The broader three-month structure reinforces that point. Shell is trading far above the 3,681.50 three-month high only by a small margin, while the 2,559.50 three-month low remains a long way below, highlighting how much of the prior recovery has already been absorbed by the market. For investors reading the tape, that combination usually signals a mature uptrend rather than an early-stage breakout.
Oscillators & Momentum
The momentum picture is less decisive than the trend picture. The RSI at 58.3 is neutral, which means the stock is neither overbought nor oversold; it is simply sitting in the middle ground where trend-followers still have room, but fresh buyers are not yet showing urgency. The Stochastic %K at 64.1 and %D at 59.2 are also neutral, indicating the stock has upward bias without entering the kind of hot zone that often precedes exhaustion.
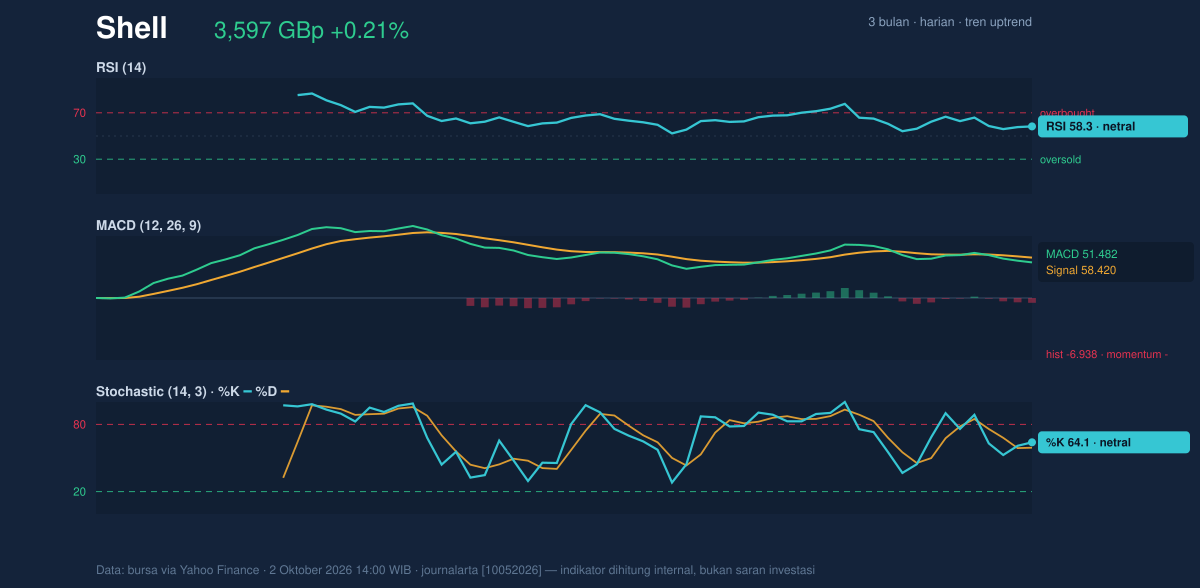
The more important signal comes from MACD. Shell’s MACD at 51.482 is still below its signal line at 58.420, with a -6.938 histogram, which means momentum remains negative even though price is rising. In plain English, the shares are climbing, but the internal push behind the move is not fully aligned yet. That kind of divergence often suggests the rally is being sustained by trend support and steady demand rather than strong acceleration.
For now, the oscillators do not argue for a reversal. They do, however, warn that the stock may need a clearer burst in participation before it can push through resistance with conviction.
Volatility & Volume
Volatility is moderate, not extreme. The ATR(14) at 70.27, or about 2.0% of price, suggests Shell can still move meaningfully in a session, but not in a disorderly way. The Bollinger Band width of 5.7% is relatively tight and described as a squeeze, which is often the market’s way of saying a larger move may be building after a period of compression.
That compression matters because it changes how traders interpret the next break. A squeeze does not predict direction on its own, but when it appears alongside an uptrend and price above the middle band at 3,566.30, it tends to favor a continuation attempt unless momentum weakens further.
Volume is less supportive than price. Last turnover of 9,527,062 was only 0.9× the 20-day average of 10,053,163, so the latest rise is happening without strong participation. On its own, that is not bearish, but it does mean the move lacks the kind of heavy confirmation that usually accompanies a decisive breakout. The one encouraging counterweight is that OBV is rising, which suggests underlying accumulation is still present even if the day’s volume was subdued.
Key Levels & Scenarios
The immediate ceiling is clear: 3,654.50. If Shell can close through that level, the chart would start to look more like a squeeze resolving upward, with the upper Bollinger Band at 3,668.38 and the three-month high at 3,681.50 acting as the next reference points. Failure there would keep the stock boxed into its current range.
On the downside, the first line of defense is the SMA20 at 3,566.30, followed by support at 3,482.50. A slip back through the moving average would not break the trend immediately, but it would weaken the current structure and suggest the recent advance is losing traction. A break below support would be more serious, because it would leave Shell vulnerable to a deeper retracement toward the lower band at 3,464.22.
Technical Verdict: HOLD (wait & see)
HOLD (wait & see) is the clearest technical read because the trend is constructive, but momentum and volume are not yet strong enough to confirm a clean breakout.
- Reason 1: Price remains above SMA20 and SMA50, and the SMA20 is rising, which supports the uptrend.
- Reason 2: MACD is negative versus its signal line, showing momentum is not fully confirming the price rise.
- Reason 3: The Bollinger squeeze suggests a larger move may be coming, but direction is not yet proven by volume.
- Verdict invalidated if price breaks below 3,482.50, which would weaken the near-term structure and challenge the current trend.
- Ideal Entry Range: 3,566.30 to 3,482.50
- Exit Target: 3,654.50, then 3,668.38
- Stop Loss protection: below 3,482.50, with the lower Bollinger Band at 3,464.22 as the next technical reference
In plain English: Shell is still rising, but the chart wants proof before it commits to a stronger move.
“It’s holding, but it has not yet earned the breakout.”
Summary Data Shell
| Last price | 3,596.50 GBp |
| Change 1 day / 5 days / 1 month | 0.21% / -0.40% / 4.64% |
| Trend / MA-cross | uptrend / none |
| SMA20 / SMA50 | 3,566.30 / 3,437.90 |
| RSI (14) / Stochastic %K | 58.3 / 64.1 |
| Bollinger %B / ATR | 65% / 70.27 |
| Support / Resistance 20 days | 3,482.50 / 3,654.50 |
| Data as of | 2 Oktober 2026 14:00 WIB |
Track Shell share price daily: live levels, support/resistance and our full Shell analysis history.



