Shell Stock Drops 2.31%, Momentum Gains In Focus
On September 22, 2026: price 3,488.50 GBp, trend uptrend, RSI 59.6, support 3,311.00, resistance 3,652.50. technical analysis of shell stock.

Shell plc edged lower on the London Stock Exchange on Thursday, with the shares last changing hands at 3,488.50 GBp, down from the previous close of 3,571.00, even as the broader technical picture still points to an uptrend. The move matters because the stock is now trading just above its short-term trend line, which means the market is not rejecting the recent advance — it is testing whether that advance still has enough follow-through after a weak daily finish.
Trend & Price Action
The most important signal in the chart is that Shell remains above its SMA20 at 3,472.78 and comfortably above its SMA50 at 3,359.82. That matters because a share price holding above both short- and medium-term averages usually tells you buyers have not lost control of the broader trend, even if the latest session was soft.
The slope of the SMA20 is rising by 1.49% over 5 days, which reinforces that the recent pullback has not yet broken the trend structure. There is also no fresh MA-cross, so the chart is not flashing a new shift in regime; instead, it suggests the market is pausing within an existing advance rather than reversing it. As shown in the chart, the price is sitting around the middle of the recent range, which is a sign of balance rather than panic.
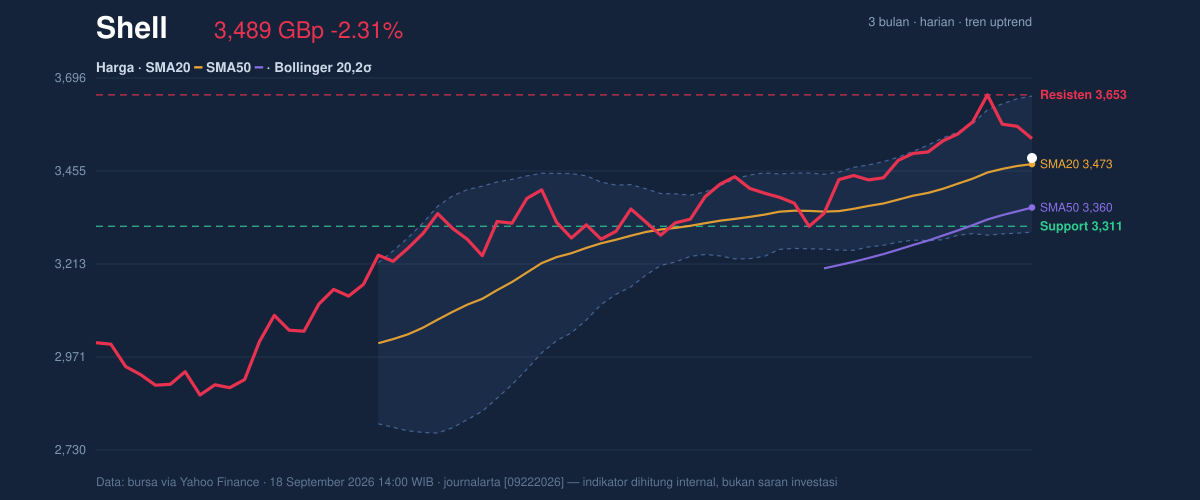
The broader reference points are still constructive. Shell is trading well below its 3-month high of 3,663.50, but far above the 3-month low of 2,559.50, leaving room for continuation if buyers reclaim nearby resistance. In plain terms, the stock is neither stretched at the top nor damaged at the base.
Oscillators & Momentum
Momentum indicators are mixed, but not weak. The RSI(14) at 59.6 sits in neutral territory, which means the shares are not overbought and still have space to extend higher before momentum becomes crowded. That is usually a healthier position than an RSI deep in the 70s, because it suggests the market is not yet euphoric.
The Stochastic %K at 55.3 and %D at 68.1 also reads as neutral, though the gap between the two lines hints that short-term momentum has cooled from stronger levels. This is not a bearish collapse; it is more a sign that the stock is digesting recent gains. As shown in the momentum chart, the message is one of consolidation rather than exhaustion.
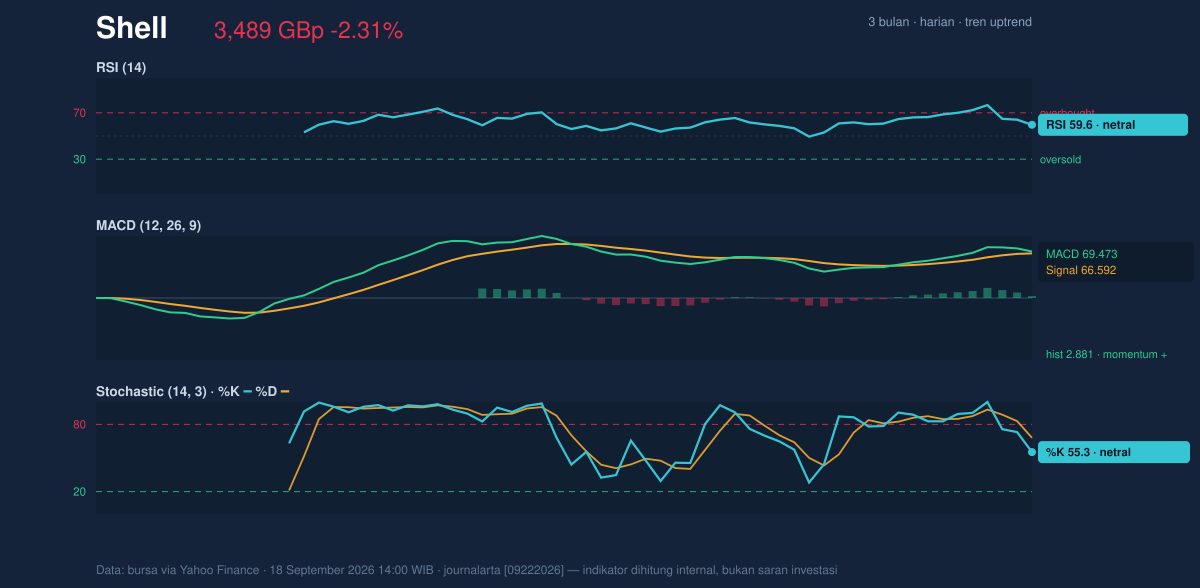
The more encouraging part is the MACD setup. MACD at 69.473 remains above the signal line at 66.592, with a positive histogram of 2.881. That combination matters because MACD above signal usually indicates underlying buying pressure is still intact, even if the daily price change was negative. In other words, the trend impulse has not fully rolled over.
Volatility & Volume
Volatility is moderate rather than extreme. The ATR(14) at 65.45, equal to 1.9% of price, suggests Shell can move, but not in a disorderly way. That creates a market where breakouts may develop gradually rather than through violent gaps, and where support and resistance levels are likely to matter.
The Bollinger Bands help frame that condition. Price is near the middle band at 3,472.78, with the upper band at 3,649.56 and the lower band at 3,295.99. The %B at 54% says the share price is slightly above the midpoint of the band structure, while the 10.2% band width points to normal volatility, not a squeeze. That is important: there is no strong compression signal warning of a sudden expansion, but there is enough room for price to travel if volume keeps supporting the move.
Volume is the clearest bullish clue in the data. Trading volume of 23,628,589 was about 2.1× the 20-hour average of 11,300,403, and OBV is rising. That combination matters because price advances backed by heavier participation are more credible than quiet drifts higher. Even though the stock fell on the day, the surge in turnover and rising OBV suggest institutions or larger participants were active, which can be a sign of accumulation rather than distribution.
Key Levels & Scenarios
The nearest support to watch is 3,311.00, the 20-hour support level. If Shell holds above that area, the current uptrend remains structurally intact and the market can continue to treat the recent dip as a normal retracement. If that support fails, the chart would lose some of its short-term stability and the lower Bollinger band at 3,295.99 becomes the next technical reference.
On the upside, the key resistance is 3,652.50, which sits close to the 3-month high of 3,663.50. A move through that zone would matter because it would place the share price back near recent highs and signal that buyers are willing to absorb supply at the top of the range. Until then, price is still working inside a broad band rather than breaking decisively higher.
The current location — around the middle of the recent range — is neutral but constructive. It says the market has not yet chosen between a continuation higher and a deeper retracement, but the trend, MACD, and volume profile still lean in favor of resilience.
Technical Verdict: HOLD (wait & see)
HOLD (wait & see)
- Reason 1: Price remains above SMA20 at 3,472.78 and above SMA50 at 3,359.82, which keeps the broader trend positive.
- Reason 2: MACD is above its signal line with a positive histogram, showing momentum has not fully deteriorated.
- Reason 3: Volume is 2.1× average and OBV is rising, which supports the idea that participation is still present.
- Verdict invalidated if price falls below 3,311.00, because that would break the nearest support and weaken the short-term trend structure.
- Ideal Entry Range: 3,472.78 to 3,488.50
- Exit Target: 3,652.50
- Stop Loss protection: 3,311.00
In plain English: Shell still looks technically healthy, but the chart is asking for confirmation before the next move higher.
“The market is not broken, but it is asking for proof.”
Summary Data Shell
| Last price | 3,488.50 GBp |
| Change 1 day / 5 days / 1 month | -2.31% / -1.76% / 1.41% |
| Trend / MA-cross | uptrend / none |
| SMA20 / SMA50 | 3,472.78 / 3,359.82 |
| RSI (14) / Stochastic %K | 59.6 / 55.3 |
| Bollinger %B / ATR | 54% / 65.45 |
| Support / Resistance 20 days | 3,311.00 / 3,652.50 |
| Data as of | 18 September 2026 14:00 WIB |



