Shell Stock Technicals: Gains 2.06% on Thursday, Testing Key Resistance
On October 29, 2026: price 4,038.00 GBp, trend uptrend, RSI 70.0, support 3,596.50, resistance 4,038.00. technical analysis of shell stock.
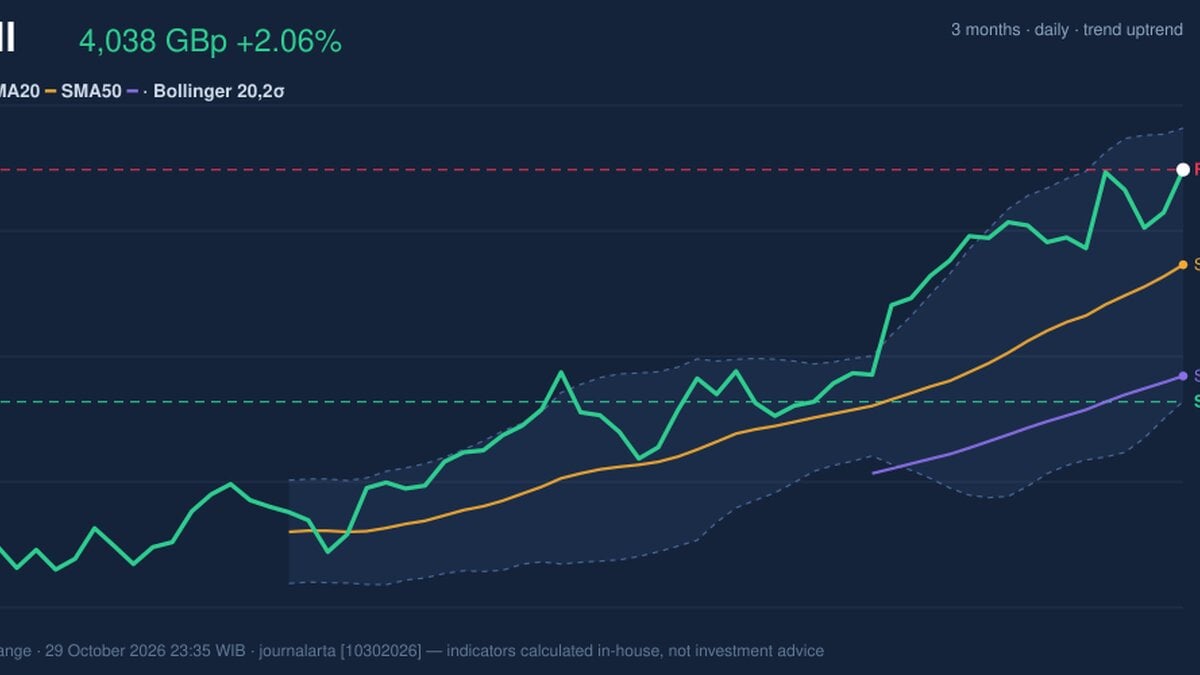
Shell plc shares closed at 4,038.00 pence on the London Stock Exchange on Thursday, October 29, 2026, up 2.06% on the day from a previous close of 3,956.50 pence, and settled at the highest level in 20 sessions. The gain extends a run of 3.84% over five days and 12.51% over one month, leaving the stock within reach of its three-month high of 4,110.00 pence.
Why Shell is in focus today
- Closed at a 20-day high (4,038.00)
- Trading near its 3-month high (4,110.00)
- MACD histogram has just turned positive
- Uptrend confirmed (5-day change 3.84%)
Selected automatically from 16 LSE (UK) stocks by a technical-signal score with daily weighted randomisation — not a recommendation.
Trend & Price Action
The picture is one of a well-established advance rather than a sudden spike. The price sits above the 20-day simple moving average (SMA20, the average closing price over the past 20 trading days) at 3,857.20, and that in turn sits well above the 50-day average at 3,645.54. When shorter averages stack above longer ones in this way, it generally signals that buyers have been consistently paying more over time. The 20-day average itself rose 2.57% over five days, confirming the upward tilt is still building rather than flattening. No new moving-average crossover has formed, so the trend is an ongoing one, not a fresh turning point.
Thursday's close also matters for where it landed within the recent range: at 4,038.00 pence, the price touched the top of its 20-day range, which means the 20-day resistance (a ceiling where sellers have previously emerged) and the closing price are now the same number. The three-month high of 4,110.00 pence is only a short distance above, while the three-month low of 3,253.00 pence shows how far the stock has climbed from its trough.
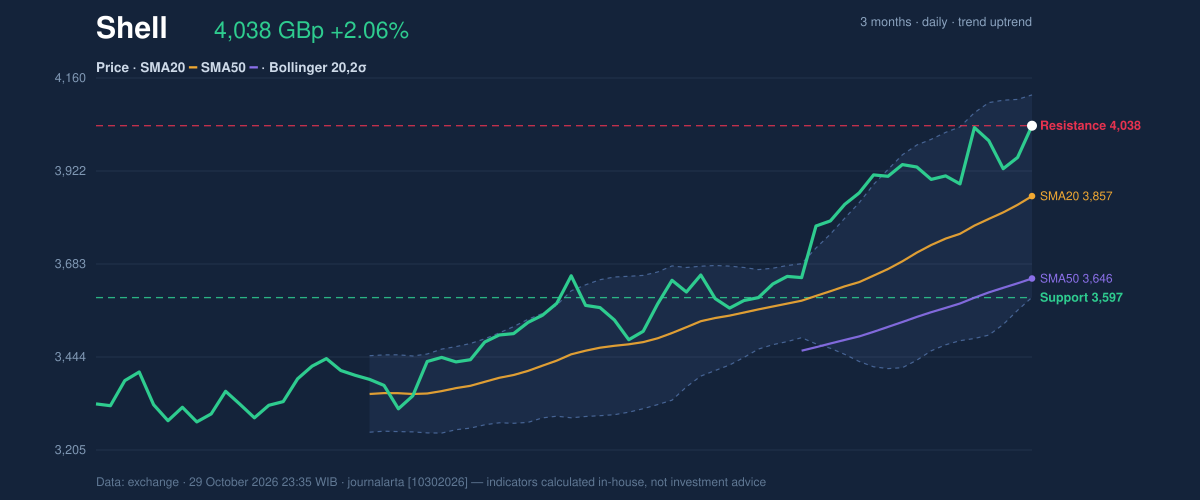
As shown in the chart, the price has pushed toward the upper Bollinger band while the 20-day support near 3,596.50 pence sits far below, a gap that underlines how extended the recent move has become.
Oscillators & Momentum
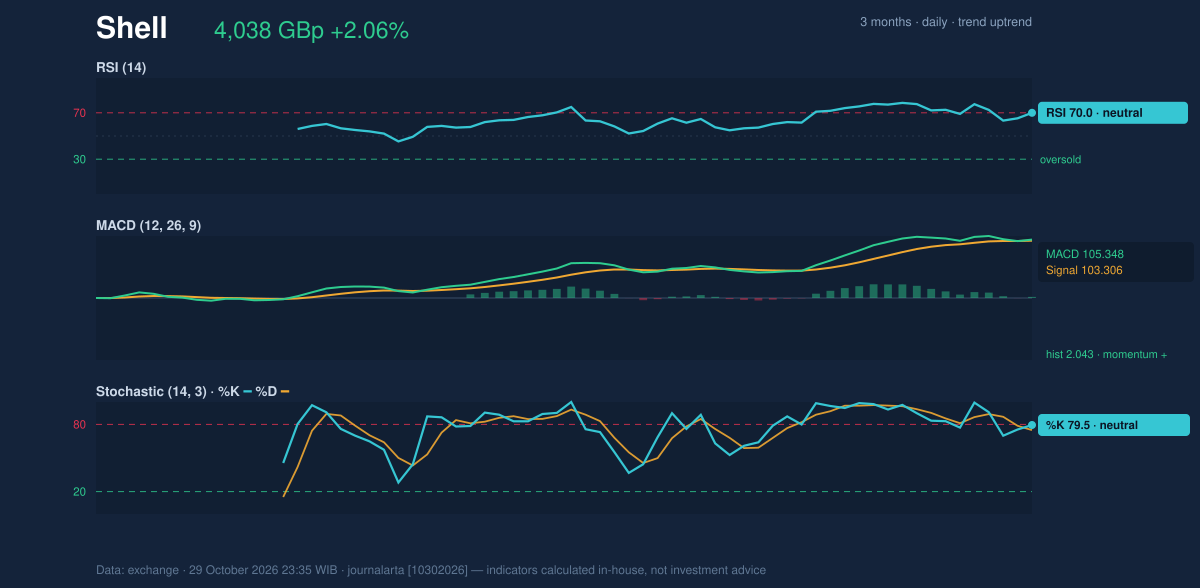
Momentum indicators agree with the trend but are starting to flag how stretched it is. The Relative Strength Index (RSI), which gauges the speed of recent gains on a 0–100 scale, reads 70.0. That sits right at the conventional threshold where a stock is often described as overbought, meaning it has risen quickly and may be due for a pause, though strong trends can hold such readings for some time. The Stochastic oscillator, which compares the close with the recent trading range, shows %K at 79.5 and %D at 74.9, both in neutral territory but leaning high, with the faster line above the slower one.
The MACD, a trend-following gauge built from two moving averages, stands at 105.348 against a signal line of 103.306. The histogram, the gap between them, is +2.043 and has only just turned positive. That is a modest margin: it indicates momentum has tipped back in favour of buyers, but the cushion is thin and could vanish quickly if prices stall.
Volatility & Volume
Bollinger Bands, which wrap a price chart in a channel two standard deviations either side of the 20-day average, put the upper band at 4,116.98 and the lower at 3,597.42. The %B reading of 85% shows the price is in the upper part of that channel, though not through it. Band width is 13.5%, which the data classes as normal, so there is no squeeze or sharp expansion hinting at an imminent breakout. The Average True Range (ATR), a measure of typical daily movement, is 82.21 pence, or 2.0% of the price, a moderate level of volatility. In practical terms, daily swings of roughly that size are ordinary for the stock right now.
Participation is the less convincing element. Volume of 7,549,671 shares was 0.9 times the 20-day average of 8,335,527, so the rally to a 20-day high came on slightly lighter-than-normal trading. On-balance volume (OBV), which adds volume on up days and subtracts it on down days, is rising, which supports the advance, but the slightly thin turnout means the latest push lacks emphatic backing.
Key Levels & Scenarios
The nearest hurdle is the three-month high at 4,110.00 pence, closely followed by the upper Bollinger band at 4,116.98. A close above that zone would mean the stock has cleared its recent ceiling. On the downside, the first reference is the SMA20 at 3,857.20, with the 20-day support at 3,596.50 and the lower Bollinger band at 3,597.42 clustering together as a deeper floor. If the price slips back below the SMA20, it would suggest the recent surge is being unwound.
Technical Verdict: HOLD (wait & see)
The indicators point to HOLD (wait & see). The trend is clearly upward, but several signals argue for patience:
- RSI at 70.0 sits at the edge of overbought territory, and the Stochastic is near 80.
- The MACD histogram turned positive only just, at 2.043, a slim margin.
- Volume at 0.9 times average does not strongly confirm the move to a 20-day high.
Technical reference levels, based strictly on the data:
- Entry range: 3,857.20 (SMA20) to 3,900 area is not in the data; the data-based reference is a pullback toward the SMA20 at 3,857.20.
- Exit target: 4,110.00 (three-month high), with 4,116.98 (upper Bollinger band) as the extension.
- Stop loss: below 3,597.42 (lower Bollinger band), close to the 3,596.50 support.
The verdict is invalidated if the price falls below 3,596.50 pence, or conversely strengthens if it closes above 4,116.98 on rising volume. In plain terms: Shell's shares are in a solid uptrend but look stretched after a quick climb, so the chart favours waiting for a clearer signal. This is technical analysis, not an investment recommendation.
| Indicator | Value |
|---|---|
| Last price | 4,038.00 GBp |
| SMA20 / SMA50 | 3,857.20 / 3,645.54 |
| Bollinger (upper / mid / lower) | 4,116.98 / 3,857.20 / 3,597.42 |
| RSI(14) | 70.0 |
| Stochastic %K / %D | 79.5 / 74.9 |
| MACD / signal / histogram | 105.348 / 103.306 / 2.043 |
| ATR(14) | 82.21 (2.0%) |
| Support / resistance (20 days) | 3,596.50 / 4,038.00 |
| 3-month high / low | 4,110.00 / 3,253.00 |
Summary Data Shell
| Last price | 4,038.00 GBp |
| Change 1 day / 5 days / 1 month | 2.06% / 3.84% / 12.51% |
| Trend / MA-cross | uptrend / none |
| SMA20 / SMA50 | 3,857.20 / 3,645.54 |
| RSI (14) / Stochastic %K | 70.0 / 79.5 |
| Bollinger %B / ATR | 85% / 82.21 |
| Support / Resistance 20 days | 3,596.50 / 4,038.00 |
| Data as of | 29 October 2026 23:35 WIB |
Disclaimer: This technical analysis is generated automatically from exchange data and indicators calculated by JournalArta, for information and education only. The verdict and the entry, target and stop-loss levels are not investment advice or a solicitation to buy or sell any security. Investment decisions and their risks rest solely with the reader.
Track Shell share price daily: live levels, support/resistance and our full Shell analysis history.