LSEG Stock Gains 2.81%, Golden Cross Formed In Focus
On October 29, 2026: price 9,444.00 GBp, trend uptrend, RSI 66.1, support 8,090.00, resistance 9,510.00. technical analysis of lseg stock.
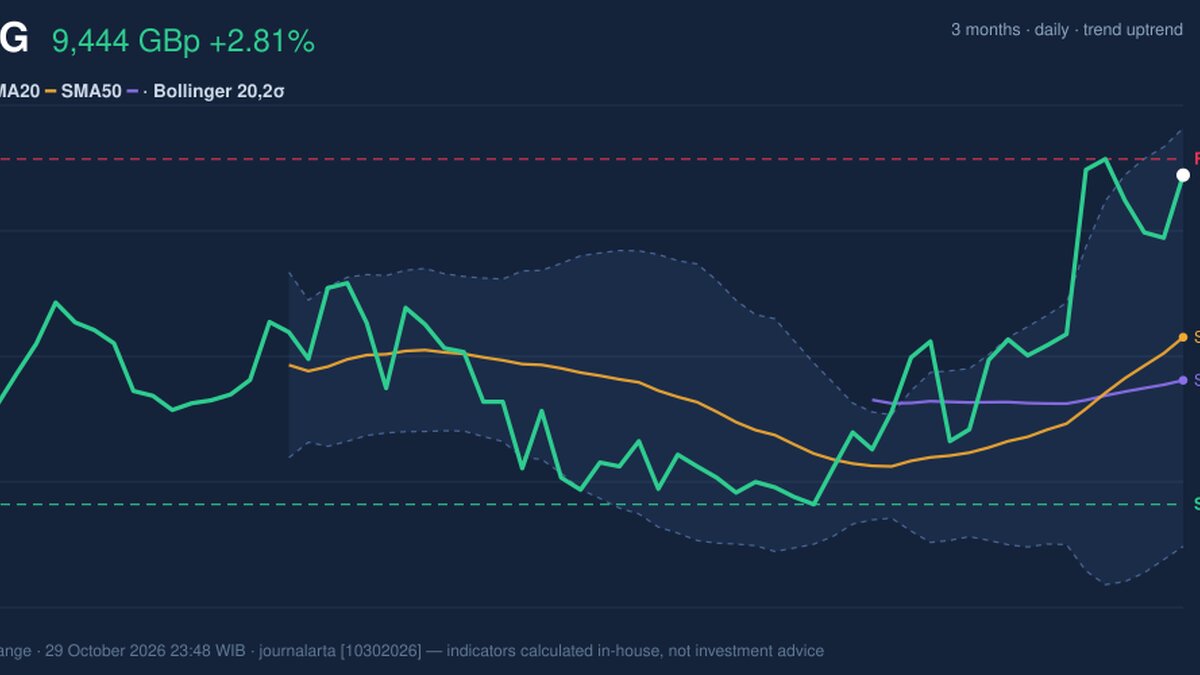
London Stock Exchange Group closed Thursday's session on October 29, 2026 at 9,444.00 pence (GBp), up 2.81% on the day and within 124 pence of its three-month high of 9,568.00, according to exchange data. A golden cross, in which a short-term average climbs above a longer one, formed four sessions before the latest session. Together, the two signals explain why the stock is in focus: it is gaining ground, but it is doing so close to the top of its recent range.
Why LSEG is in focus today
- Trading near its 3-month high (9,568.00)
- Fresh golden cross: SMA20 crossed above SMA50
Selected automatically from 16 LSE (UK) stocks by a technical-signal score with daily weighted randomisation — not a recommendation.
Trend & Price Action
The shares are trading above the 20-day simple moving average (SMA20) at 8,777.30 and the 50-day average (SMA50) at 8,600.28. Those averages smooth out daily noise, so a price sitting well above both usually points to buyers consistently paying up. The 20-day average rose 3.47% over five days, a steep slope that shows the advance is not a single-session event. The golden cross, formed four sessions before the latest session, adds a longer-term layer: the faster average has overtaken the slower one, which is typically read as an improving medium-term trend.
The picture is not one of unbroken gains, though. The stock gained 16.31% over one month but slipped 0.23% over five days, which suggests most of the rally came earlier and that the past week was a pause before Thursday's jump. At roughly 95% of its 20-day range, the price has little room before it tests the ceiling.
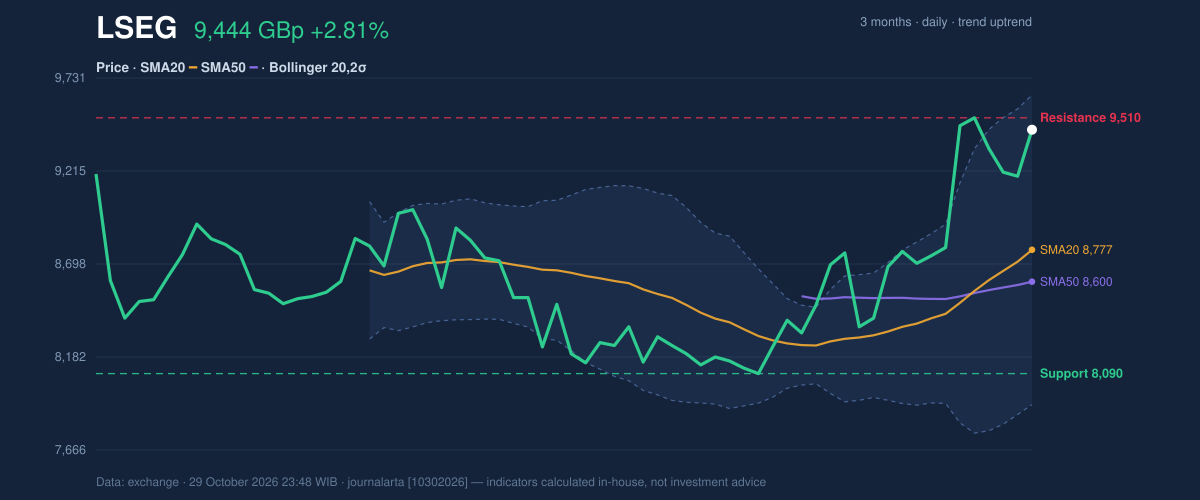
As the chart shows, the price is pressing against the upper Bollinger band at 9,637.03. Bollinger bands are a volatility envelope drawn two standard deviations around the 20-day average. The %B reading of 89% means the close sits near the top of that envelope, and the band width of 19.6% is classed as normal, so there is no sign of an unusually compressed or overstretched market.
Oscillators & Momentum
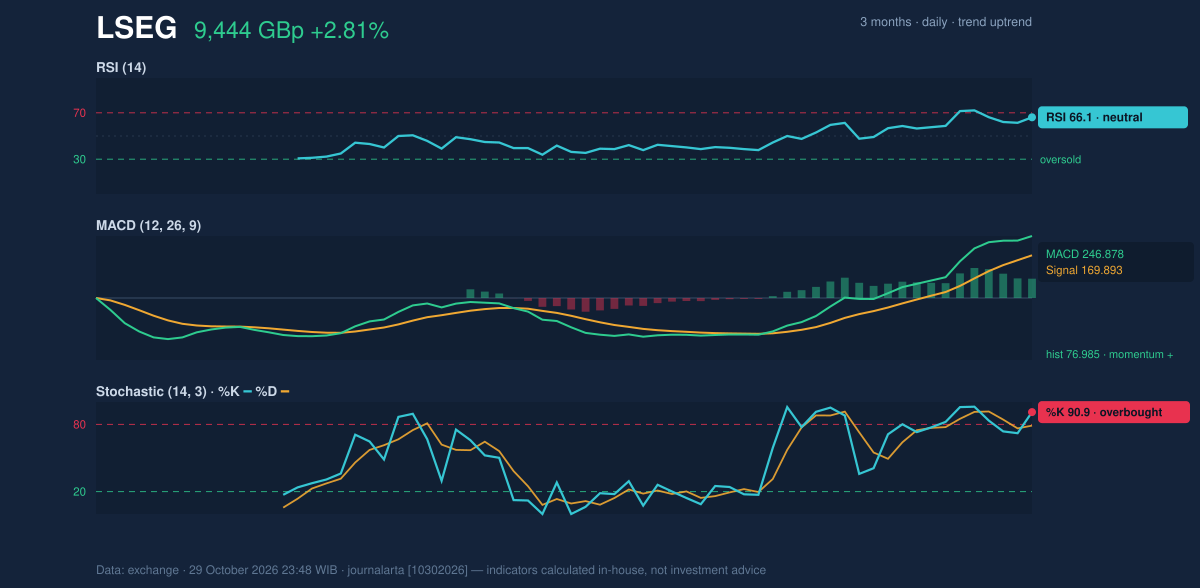
Momentum indicators agree with the trend but differ on how much is left. The Relative Strength Index (RSI), which measures the pace of recent gains on a 0-100 scale, stands at 66.1, in neutral territory and short of the 70 mark often used to flag stretched conditions. The Stochastic oscillator, which compares the close with the recent trading range, is hotter: %K at 90.9 and %D at 78.9 are in overbought territory. Because the Stochastic reacts faster than the RSI, it is picking up how sharply the price has moved toward the top of its range.
The MACD, a gauge built from the gap between two moving averages, reads 246.878 against a signal line of 169.893. The histogram of 76.985 is positive, meaning upward momentum is still widening rather than fading.
Volatility & Volume
The 14-day Average True Range (ATR), a measure of typical daily swings, is 314.31 pence, or 3.3% of the price, which counts as moderate volatility. In practical terms, a move of that size in either direction would not be unusual for this stock. That matters given how close the price is to resistance.
Participation is the soft spot. Thursday's volume of 952,877 shares was only 0.7 times the 20-day average of 1,351,638. A rise of nearly 3% on below-average turnover suggests conviction was less broad than the price move implies. Offsetting that, on-balance volume (OBV), which tracks whether volume flows into rising or falling sessions, is rising, so the accumulation trend has not broken.
Key Levels & Scenarios
The nearest ceiling is 20-day resistance at 9,510.00, followed by the three-month high at 9,568.00 and the upper Bollinger band at 9,637.03. A close above these levels on stronger volume would show the rally broadening. If the price stalls beneath them, the overbought Stochastic raises the odds of a pullback toward the middle band and SMA20 near 8,777.30. Deeper support sits at 8,090.00, close to the three-month low of 8,012.00.
Technical Verdict: HOLD (wait & see)
The verdict is HOLD (wait & see), based on three readings. The trend is constructive, with price above both averages and a golden cross in place. But the Stochastic at 90.9 is overbought and the price is at 95% of its range, leaving limited cushion. And volume at 0.7 times normal does not yet confirm a breakout.
- Ideal entry range: 8,777.30 to 9,000 area is not in the data; the data-based zone is the SMA20 at 8,777.30 up toward the SMA50-supported region above 8,600.28, a pullback area rather than current levels.
- Exit target: 9,510.00 (20-day resistance), then 9,568.00 (three-month high).
- Stop loss: below 8,600.28 (SMA50); a break of 8,090.00 support would signal a deeper reversal.
The verdict is invalidated if the price closes below 8,600.28, or turns bullish if it clears 9,568.00 on above-average volume.
In plain terms: the stock is rising and the trend looks healthy, but it has run hard and sits near a ceiling, so the technical signals favour waiting for a clearer move. This is technical analysis, not an investment recommendation.
| Indicator | Value |
|---|---|
| Last price | 9,444.00 GBp |
| 1-day / 5-day / 1-month change | 2.81% / -0.23% / 16.31% |
| SMA20 / SMA50 | 8,777.30 / 8,600.28 |
| Bollinger (upper / middle / lower) | 9,637.03 / 8,777.30 / 7,917.57 |
| %B / band width | 89% / 19.6% |
| RSI(14) | 66.1 |
| Stochastic %K / %D | 90.9 / 78.9 |
| MACD / signal / histogram | 246.878 / 169.893 / 76.985 |
| ATR(14) | 314.31 (3.3%) |
| Volume vs 20-day average | 952,877 vs 1,351,638 (0.7x) |
| Support / resistance (20-day) | 8,090.00 / 9,510.00 |
| 3-month high / low | 9,568.00 / 8,012.00 |
Summary Data LSEG
| Last price | 9,444.00 GBp |
| Change 1 day / 5 days / 1 month | 2.81% / -0.23% / 16.31% |
| Trend / MA-cross | uptrend / golden |
| SMA20 / SMA50 | 8,777.30 / 8,600.28 |
| RSI (14) / Stochastic %K | 66.1 / 90.9 |
| Bollinger %B / ATR | 89% / 314.31 |
| Support / Resistance 20 days | 8,090.00 / 9,510.00 |
| Data as of | 29 October 2026 23:48 WIB |
Disclaimer: This technical analysis is generated automatically from exchange data and indicators calculated by JournalArta, for information and education only. The verdict and the entry, target and stop-loss levels are not investment advice or a solicitation to buy or sell any security. Investment decisions and their risks rest solely with the reader.
Track LSEG share price daily: live levels, support/resistance and our full LSEG analysis history.