Rio Tinto Stock Technicals: Drops 2.93% on Thursday, RSI Oversold
On October 29, 2026: price 6,206.00 GBp, trend downtrend, RSI 27.2, support 6,206.00, resistance 7,183.00. technical analysis of rio tinto stock.
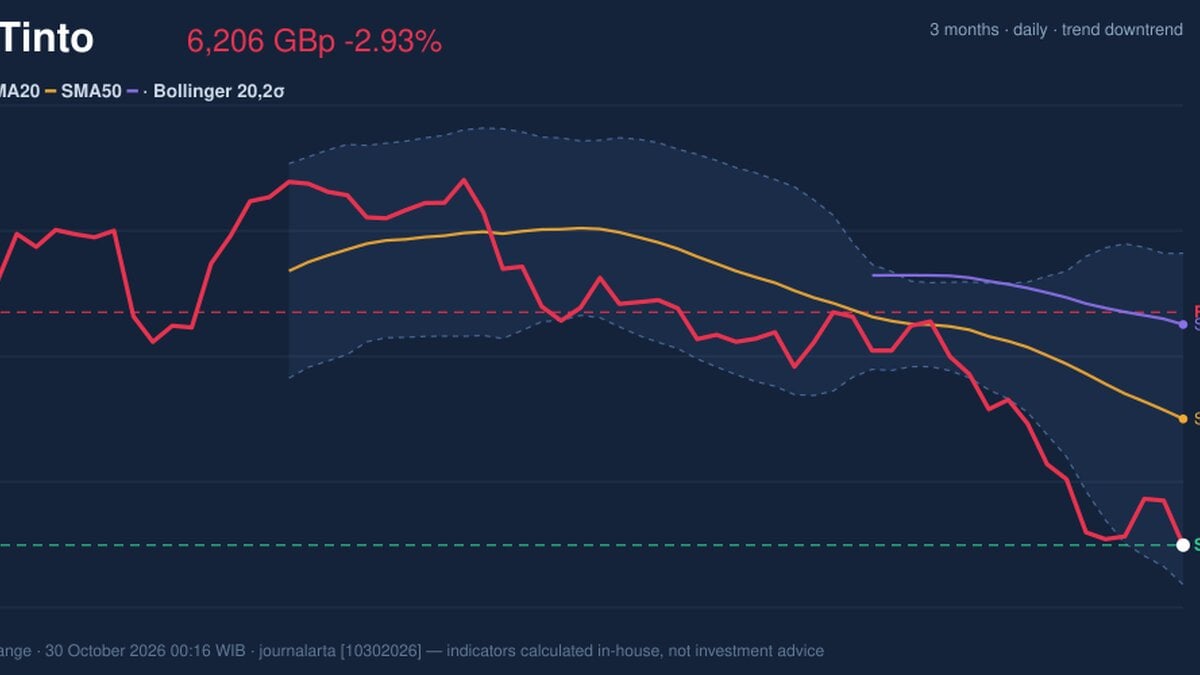
Rio Tinto, one of the world's biggest miners and a bellwether for global metals demand, closed Thursday's session on the London Stock Exchange at 6,206.00 pence, its lowest finish in 20 trading days and just above the three-month floor of 6,149.00.
Why Rio Tinto is in focus today
- Volume at 1.5× the 20-day average
- Closed at a 20-day low (6,206.00)
- Trading near its 3-month low (6,149.00)
- RSI(14) at 27.2 — oversold zone
Selected automatically from 16 LSE (UK) stocks by a technical-signal score with daily weighted randomisation — not a recommendation.
The shares fell 2.93% on October 29, 2026, from a previous close of 6,393.00. The five-day change is -0.86% and the one-month change is -10.76%, according to exchange data. Volume reached 3,425,004 shares, about 1.5 times the 20-day average of 2,274,789. A drop on heavier-than-usual trading suggests sellers were active, not just absent buyers.
That is the context. Now the detail.
Trend & Price Action
The picture is a downtrend. The price sits below both the 20-day simple moving average (SMA20) of 6,735.20 and the 50-day average (SMA50) of 7,131.36. A moving average is simply the mean closing price over a set number of days, so a price under both means recent buyers are, on average, sitting on losses. The 20-day average itself fell 2.74% over five days, showing the slide is not a one-day event. No new moving-average crossover has formed.
The stock is also at the bottom of its 20-day range: support at 6,206.00 and resistance at 7,183.00, with the price at 0% of that span. The three-month range runs from a low of 6,149.00 to a high of 7,869.80.
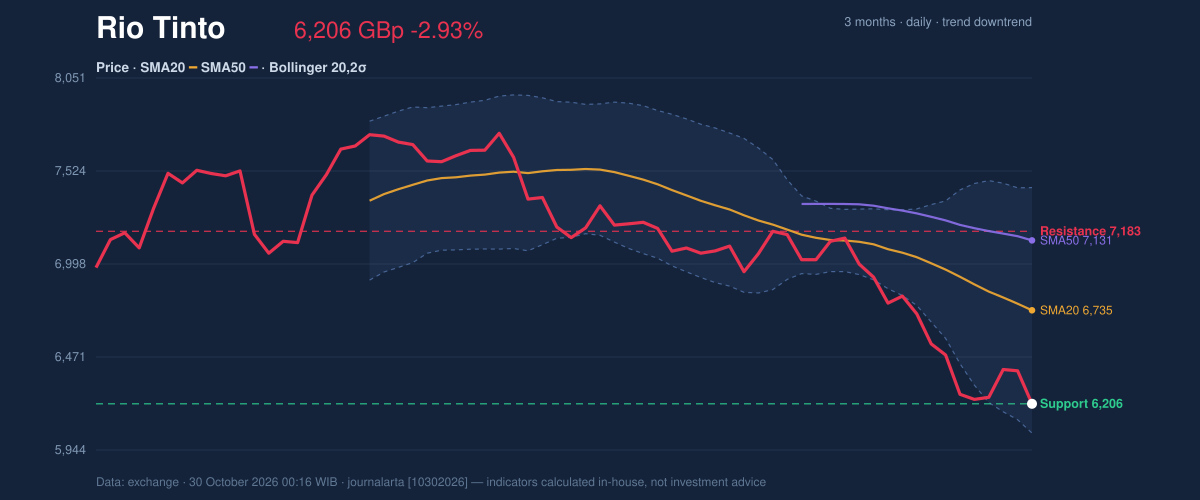
As the chart shows, the price has pushed through the middle of its Bollinger Bands, a volatility envelope set two standard deviations around the 20-day average. It now sits near the lower band at 6,040.05, with %B at 12%, meaning the price is in the bottom tenth of the band's width. Gaps like this are rarely comfortable for holders.
Oscillators & Momentum
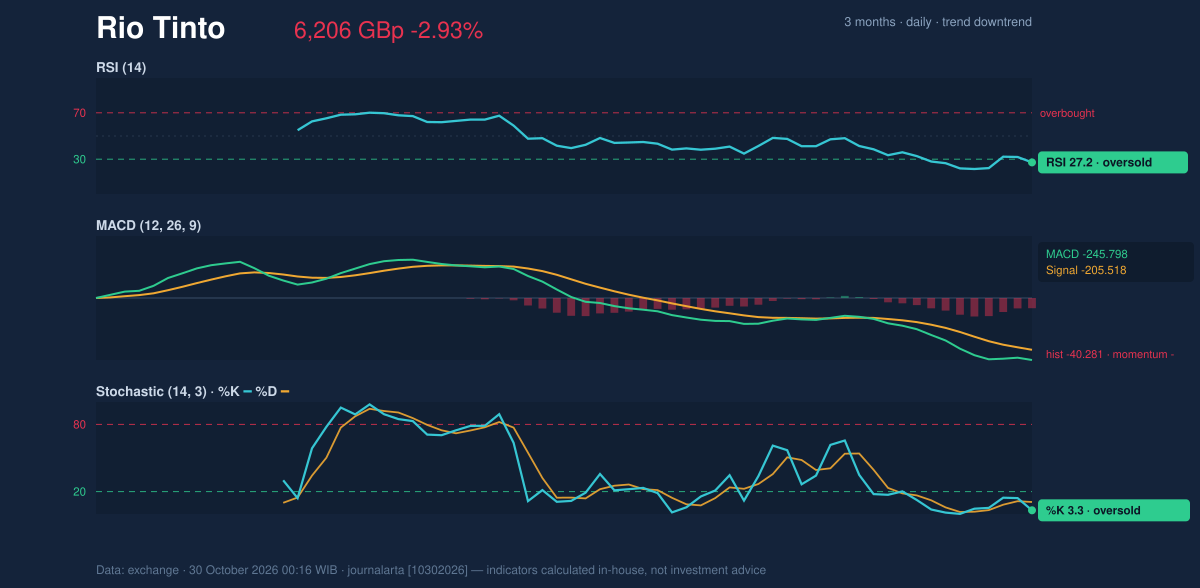
Momentum gauges agree on the weakness but flag stretched conditions. The Relative Strength Index (RSI), which measures the speed of recent gains against losses on a 0–100 scale, reads 27.2, in oversold territory (below 30). The Stochastic oscillator, which compares the close with its recent range, shows %K at 3.3 and %D at 10.7, also deeply oversold.
Oversold does not mean "about to rise." It means the selling has been unusually one-sided. In a downtrend, such readings can persist for days.
The MACD, a trend-following gauge built from two moving averages, supports that caution. It stands at -245.798, below its signal line at -205.518, with a histogram of -40.281. The gap is widening on the negative side, so downward momentum has not yet faded.
Volatility & Volume
The Bollinger Bands are widening, with band width at 20.6%, a sign that price swings are expanding. The 14-day Average True Range (ATR), a measure of typical daily movement, is 247.13 pence, or 4.0% of the price. For readers, that means a daily move of a few percent is currently ordinary for this stock, not exceptional.
On-balance volume (OBV), which adds volume on up days and subtracts it on down days, is falling. Combined with the 1.5-times volume spike, it indicates the selling carried real participation. Capitulation, where holders sell in a rush, can mark a low, but the data cannot confirm that yet.
Key Levels & Scenarios
The nearest floor is the three-month low of 6,149.00, only slightly below the close, followed by the lower Bollinger Band at 6,040.05. If the stock slips under 6,149.00, it would be trading at a three-month low and the downtrend would gain fresh confirmation. If it holds, the first hurdle is the SMA20 at 6,735.20, then the 20-day resistance of 7,183.00.
Technical Verdict: HOLD (wait & see)
The verdict is HOLD (wait & see), based strictly on the indicators.
- Trend: price below SMA20 and SMA50, with the 20-day average falling, favors the downside.
- Momentum: RSI at 27.2 and Stochastic %K at 3.3 are oversold, but MACD remains negative and widening, so the signals conflict.
- Volume: a 1.5-times spike with falling OBV shows active selling without confirmed exhaustion.
- Ideal entry range: 6,040.05–6,206.00 (lower Bollinger Band to current support), only if the price stabilizes there.
- Exit target: 6,735.20 (SMA20) first, then 7,183.00 (20-day resistance).
- Stop loss protection: below 6,040.05; the verdict is invalidated if price breaks and holds under the 3-month low of 6,149.00 and the lower band.
In plain terms: the stock looks beaten down but has not yet shown that the falling has stopped, so the technical signals call for patience.
This is technical analysis, not an investment recommendation.
| Indicator | Value |
|---|---|
| Last price | 6,206.00 GBp |
| Change (1 day / 5 days / 1 month) | -2.93% / -0.86% / -10.76% |
| SMA20 / SMA50 | 6,735.20 / 7,131.36 |
| Bollinger (upper / mid / lower) | 7,430.35 / 6,735.20 / 6,040.05 |
| %B / band width | 12% / 20.6% |
| RSI(14) | 27.2 (oversold) |
| Stochastic %K / %D | 3.3 / 10.7 |
| MACD / signal / histogram | -245.798 / -205.518 / -40.281 |
| ATR(14) | 247.13 (4.0%) |
| Volume vs 20-day average | 3,425,004 vs 2,274,789 (1.5×) |
| Support / resistance (20 days) | 6,206.00 / 7,183.00 |
| 3-month low / high | 6,149.00 / 7,869.80 |
Summary Data Rio Tinto
| Last price | 6,206.00 GBp |
| Change 1 day / 5 days / 1 month | -2.93% / -0.86% / -10.76% |
| Trend / MA-cross | downtrend / none |
| SMA20 / SMA50 | 6,735.20 / 7,131.36 |
| RSI (14) / Stochastic %K | 27.2 / 3.3 |
| Bollinger %B / ATR | 12% / 247.13 |
| Support / Resistance 20 days | 6,206.00 / 7,183.00 |
| Data as of | 30 October 2026 00:16 WIB |
Disclaimer: This technical analysis is generated automatically from exchange data and indicators calculated by JournalArta, for information and education only. The verdict and the entry, target and stop-loss levels are not investment advice or a solicitation to buy or sell any security. Investment decisions and their risks rest solely with the reader.
Track Rio Tinto share price daily: live levels, support/resistance and our full Rio Tinto analysis history.