Lloyds Stock Technicals: Drops 5.04% on Thursday, Testing Support Level
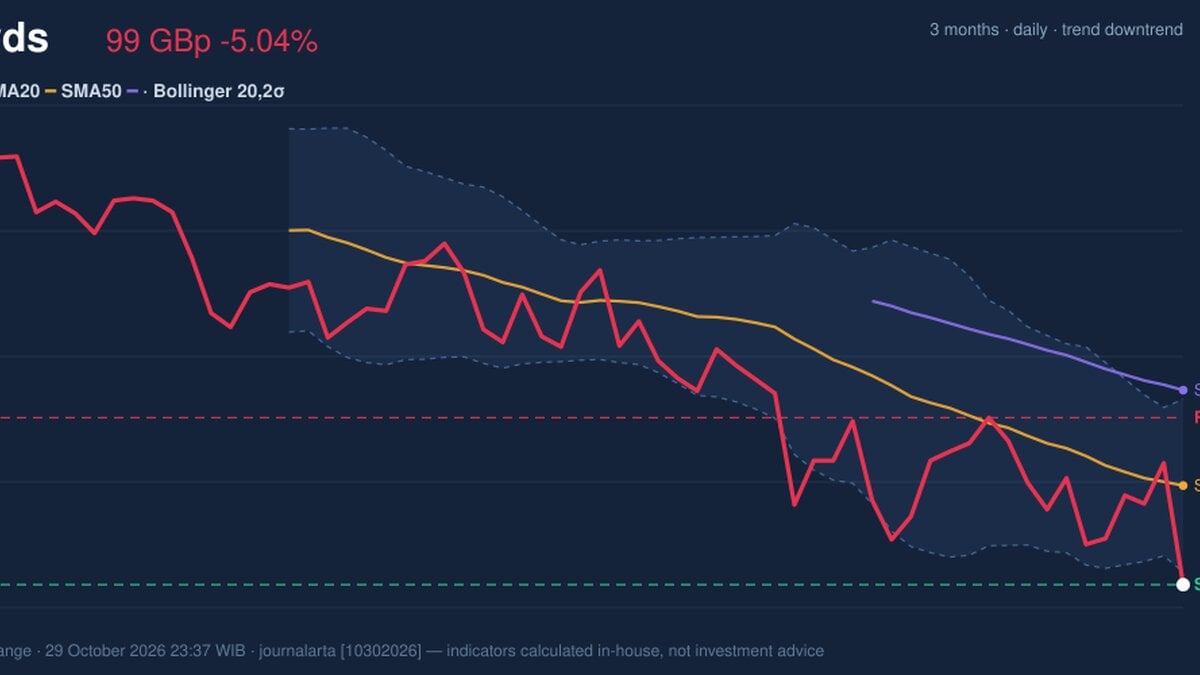
On October 29, 2026: price 98.66 GBp, trend downtrend, RSI 37.5, support 98.66, resistance 105.85. technical analysis of lloyds stock. Lloyds Stock Technicals…
Why Lloyds is in focus today
- One-day move of -5.04%, about 1.2× its average daily range (ATR)
- Volume at 2.2× the 20-day average
- Closed at a 20-day low (98.66)
- Trading near its 3-month low (97.44)
- MACD histogram has just turned negative
- Breaking out of a Bollinger squeeze (band width 7.2%)
- Downtrend extending (5-day change -1.73%)
Selected automatically from 16 LSE (UK) stocks by a technical-signal score with daily weighted randomisation — not a recommendation.
Trend & Price Action
The stock is in a downtrend. It is down 1.73% over five days and 3.37% over one month. The price sits below the 20-day simple moving average (SMA20, the average closing price over 20 sessions) at 102.93, which in turn trails the 50-day average at 107.04. When the shorter average lies under the longer one, recent buyers are on average holding losses against earlier ones. The 20-day average itself fell 1.23% over five days, so the drift lower is built into the trend rather than being a one-day event. No new moving-average crossover has formed. Within its 20-day range, the price closed at 0%: support at 98.66 is the close itself, and resistance sits at 105.85. The three-month high of 123.10 shows how much ground has been lost from the peak.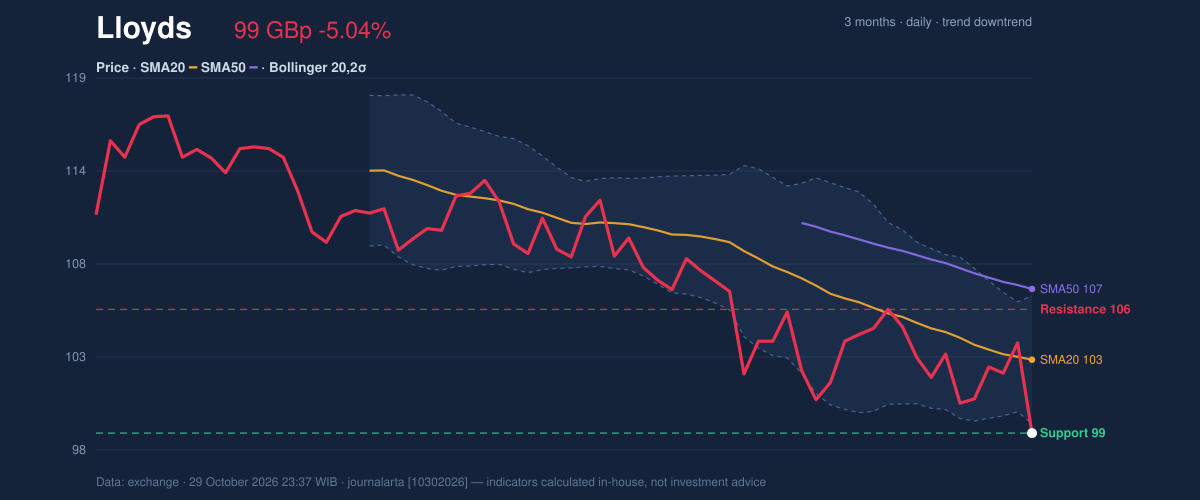
Oscillators & Momentum
Momentum indicators disagree in an instructive way. The Relative Strength Index (RSI, a 0-100 gauge of recent gains versus losses) is 37.5, neutral. It has room to fall before it flags oversold conditions. The Stochastic oscillator, which tracks where the close sits within its recent range, is more extreme: %K at 4.8 and %D at 11.6, both deep in oversold territory. That gap matters. Stochastic reacts quickly to one hard day, while RSI smooths over a longer window. An oversold reading shows the sell-off is stretched, but it does not signal a turn on its own; in a downtrend, such readings can persist. The MACD (a trend-following gauge comparing two moving averages) reads -1.667 against a signal line of -1.647. The histogram at -0.020 has just turned negative, so downward momentum is only beginning to build rather than being exhausted.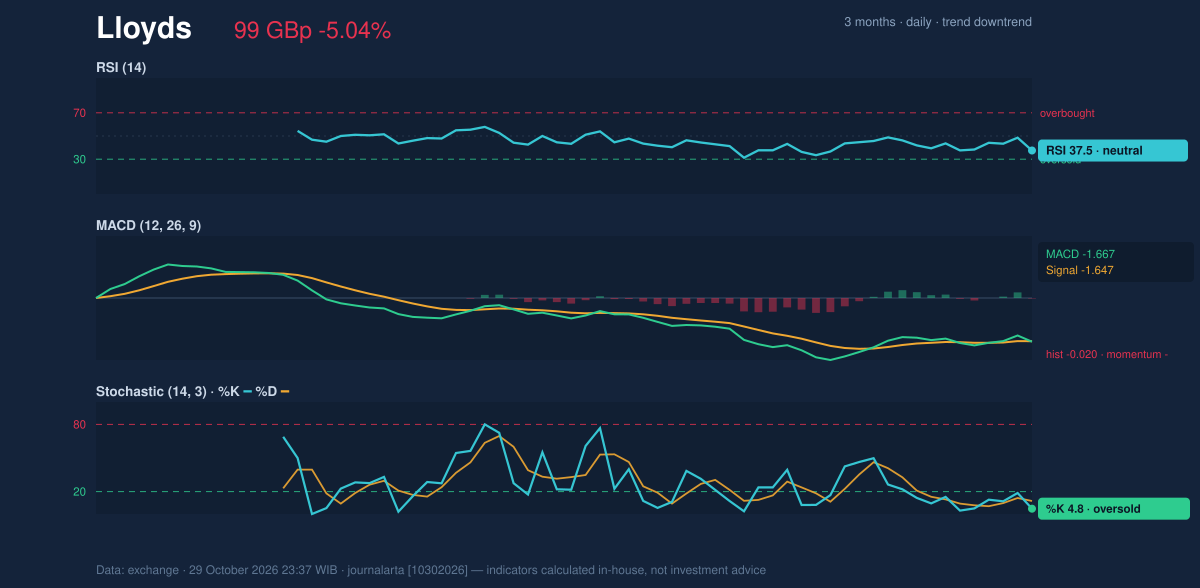
Volatility & Volume
4.1% of the price. That is high volatility. Thursday's fall was roughly 1.2 times the average daily range, large but not off the charts for this stock's recent behaviour. On-balance volume (OBV, a running tally that adds volume on up days and subtracts it on down days) is falling. Together with the 2.2-times volume surge, this indicates that selling participation is confirming the price decline rather than contradicting it.Key Levels & Scenarios
The nearest floor is the three-month low at 97.44, just 1.22 pence below the close. A break under it would put the stock at its lowest in the period, with no recent support in the data below. If the price instead holds there and climbs back above the lower band at 99.21, the oversold Stochastic reading would have some footing. The first hurdle above is the 20-day average at 102.93, then the 20-day resistance at 105.85.Technical Verdict: HOLD (wait & see)
The verdict is HOLD (wait & see), based on conflicting signals: - The price is below both moving averages, the 20-day average is falling, and OBV is declining, all pointing to a firm downtrend. - Stochastic at 4.8 is oversold while RSI at 37.5 is neutral, so the selling is stretched but not yet exhausted. - The MACD histogram has only just turned negative, and the volume surge suggests volatility will stay high. Reference levels from the data, for educational purposes: - Entry range: 97.44 to 99.21, between the three-month low and the lower Bollinger Band, if the price stabilises there. - Exit target: 102.93 first (20-day average), then 105.85 (20-day resistance). - Stop loss: below 97.44, the three-month low. The verdict is invalidated if the price falls below 97.44, which would confirm a deeper break lower. In plain terms: the stock has dropped hard and looks stretched, but the trend is still down, so the indicators favour waiting for signs of stabilisation. This is technical analysis, not an investment recommendation.| Indicator | Value |
|---|---|
| Last price | 98.66 GBp |
| 1 day / 5 days / 1 month | -5.04% / -1.73% / -3.37% |
| SMA20 / SMA50 | 102.93 / 107.04 |
| Bollinger lower / middle / upper | 99.21 / 102.93 / 106.64 |
| RSI(14) | 37.5 |
| Stochastic %K / %D | 4.8 / 11.6 |
| MACD / signal / histogram | -1.667 / -1.647 / -0.020 |
| ATR(14) | 4.01 (4.1%) |
| Support / resistance (20 days) | 98.66 / 105.85 |
| 3-month high / low | 123.10 / 97.44 |
Summary Data Lloyds
| Last price | 98.66 GBp |
| Change 1 day / 5 days / 1 month | -5.04% / -1.73% / -3.37% |
| Trend / MA-cross | downtrend / none |
| SMA20 / SMA50 | 102.93 / 107.04 |
| RSI (14) / Stochastic %K | 37.5 / 4.8 |
| Bollinger %B / ATR | -7% / 4.01 |
| Support / Resistance 20 days | 98.66 / 105.85 |
| Data as of | 29 October 2026 23:37 WIB |
Disclaimer: This technical analysis is generated automatically from exchange data and indicators calculated by JournalArta, for information and education only. The verdict and the entry, target and stop-loss levels are not investment advice or a solicitation to buy or sell any security. Investment decisions and their risks rest solely with the reader.
Track Lloyds share price daily: live levels, support/resistance and our full Lloyds analysis history.