Testing Support Level, HSBC Stock Drops 0.15% Today
On September 30, 2026: price 1,510.00 GBp, trend sideways, RSI 48.0, support 1,499.80, resistance 1,580.20. technical analysis of hsbc stock.

HSBC Holdings ended at 1,510.00 GBp on 28 September 2026 at 14:00 WIB, slipping 0.15% on the day and extending a softer stretch over the past 5 days and 1 month. The key signal is not the size of the move, but where the shares are trading: below both the SMA20 at 1,534.58 and the SMA50 at 1,533.25, with the price still sitting in the lower half of the recent range. That keeps the chart in a cautious, sideways-to-soft pattern rather than a clear uptrend.
The message from the moving averages is straightforward: HSBC has not yet reclaimed the levels that often mark renewed demand. When price stays under both the short-term and medium-term averages, rallies tend to be treated as tests of overhead supply rather than proof of a new trend. The lack of a fresh MA cross also matters. It means the chart has not produced the sort of structural shift that would usually signal a stronger trend change.
Short line: the shares are still trying to prove they can hold above the recent floor.
Trend & Price Action
As shown in the chart, HSBC is trading in a sideways trend, with the SMA20 slope down 0.16% over 5 days. That slight downward tilt is important because it shows the short-term path is still easing, even if the broader move is not a sharp selloff. The stock is also only 13% of the way up its 20-hour range between 1,499.80 support and 1,580.20 resistance, which places it close to the lower end of the band. In practical terms, that means buyers have not yet forced price back into the upper half of the recent trading zone.
The broader 3-month range adds context. HSBC is trading well above the 3-month low of 1,350.00, but still below the 3-month high of 1,610.00. That positioning suggests the market has recovered from earlier weakness, but has not regained enough momentum to challenge the top of the range with conviction.
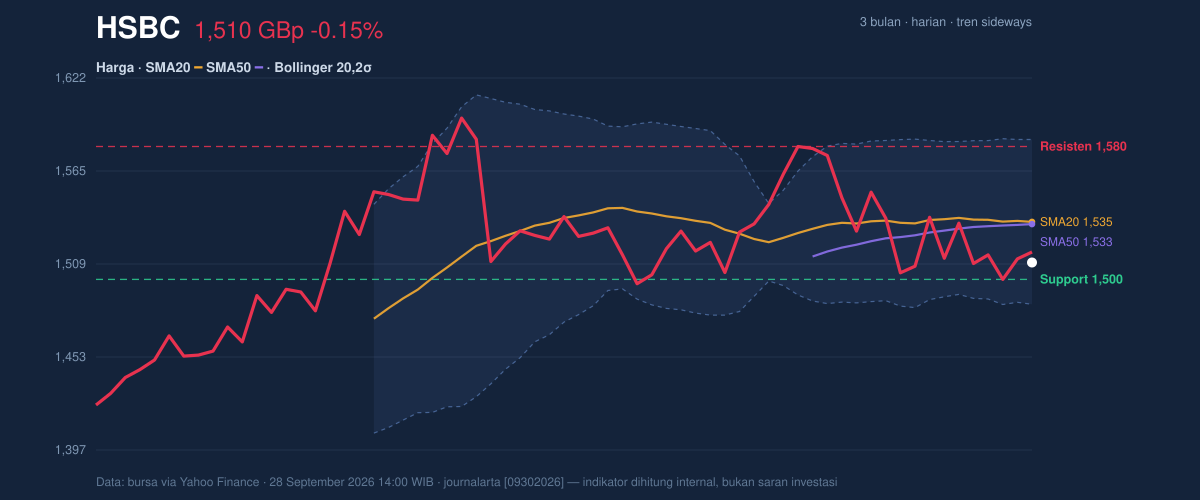
A close above the moving averages would matter because it would show the stock is no longer being capped by its recent trend line. Until then, the chart remains range-bound with a mild downward bias.
Oscillators & Momentum
The momentum indicators are mixed, and that is the most telling part of the setup. RSI(14) at 48.0 is neutral, which means the stock is neither overbought nor oversold. That is often what a market looks like when it is waiting for a catalyst. But the Stochastic %K at 29.1 and %D at 17.7 show the shares are drifting near the lower end of the momentum scale without yet reaching a decisive oversold reading. In plain language, the stock is soft, but not exhausted.
The more important signal comes from the trend-following side: MACD at -5.044, with the signal line at -1.559 and a histogram of -3.485. MACD is a momentum tool that helps show whether price pressure is improving or worsening. Here, the negative histogram says downside pressure still exceeds upside force. That does not automatically mean a larger decline is underway, but it does mean the recent bounce attempts have not yet been strong enough to shift the internal trend.
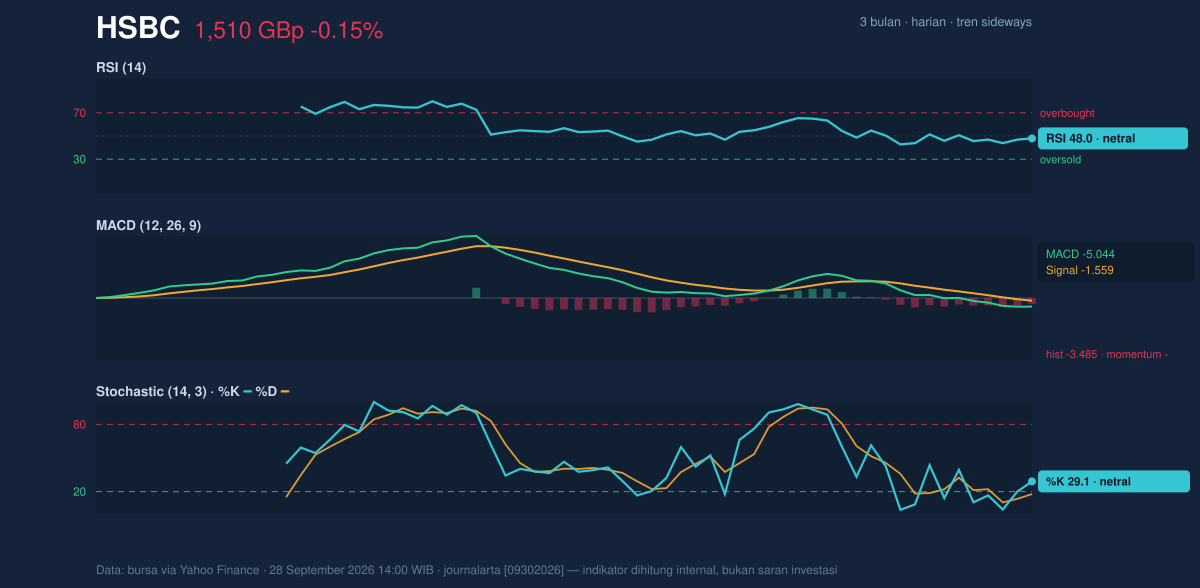
So while RSI and Stochastic are not flashing panic, MACD says the market still lacks convincing upward drive.
Volatility & Volume
Bollinger Bands are telling a different part of the story. The 20-day band width is 6.5%, and it is narrowing. A squeeze like this often means the market is storing energy for a larger move, even if the direction is not yet clear. The price sits at %B 25%, which means it is closer to the lower band at 1,484.71 than to the upper band at 1,584.45. That positioning usually reflects a market leaning weak, though not in freefall.
Volume is not confirming a strong reversal. Last trade volume was 17,725,406, below the 20-hour average of 19,459,668, or about 0.9× normal. When volume runs below average during a soft price phase, it suggests conviction is limited. The market is drifting rather than aggressively distributing. Still, the OBV is falling, and that is a quieter but important warning: on-balance volume tracks whether money flow is supporting the move, and here it is not.
ATR(14) at 30.38, or 2.0% of price, indicates moderate volatility. That matters because it suggests the stock can move enough to break the current range without needing an extreme shock. In a squeezed band, moderate ATR can translate into a fairly quick test of support or resistance once the market chooses a direction.
The setup is compressed, but not calm.
Key Levels & Scenarios
The nearest technical line in the sand is 1,499.80 support. If that floor holds, HSBC can continue to base inside the current range and potentially work back toward the 1,534.58 to 1,533.25 moving-average cluster. That cluster is important because it marks the area where the stock would need to prove it can reclaim short-term control. Above that, the next obvious barrier is 1,580.20 resistance, followed by the 1,584.45 upper Bollinger Band. A move into that zone would show the squeeze is being resolved to the upside.
If 1,499.80 fails, the chart would likely shift from range-bound weakness to a more defensive tone, because the price would be breaking the lower edge of the recent trading structure. That would also put the 1,484.71 lower Bollinger Band into focus as the next technical guide.
A simple reading: support is close, resistance is still overhead, and the stock needs a stronger momentum signal to escape the middle of the range.
Technical Verdict: HOLD (wait & see)
HOLD (wait & see) because the chart is balanced between a compressed volatility setup and still-negative momentum. The strongest reasons are:
- MACD remains negative, showing downside pressure still outweighs upside force.
- Price is below SMA20 and SMA50, so the stock has not yet reclaimed short-term trend control.
- Bollinger Bands are squeezing, which raises the chance of a directional move, but not yet a confirmed one.
Verdict invalidated if price falls below 1,499.80, because that would break the nearest support and weaken the current range structure.
- Ideal Entry Range: 1,499.80 to 1,534.58
- Exit Target (Target Price): 1,580.20 to 1,584.45
- Stop Loss Protection: below 1,484.71
For non-traders: HSBC is sitting in a tight range, and the next decisive move depends on whether support at 1,499.80 holds or gives way.
Summary Data HSBC
| Last price | 1,510.00 GBp |
| Change 1 day / 5 days / 1 month | -0.15% / -1.55% / -1.20% |
| Trend / MA-cross | sideways / none |
| SMA20 / SMA50 | 1,534.58 / 1,533.25 |
| RSI (14) / Stochastic %K | 48.0 / 29.1 |
| Bollinger %B / ATR | 25% / 30.38 |
| Support / Resistance 20 days | 1,499.80 / 1,580.20 |
| Data as of | 28 September 2026 14:00 WIB |

