Momentum Gains, AstraZeneca Stock Drops 0.99% Today
On September 30, 2026: price 12,428.00 GBp, trend sideways, RSI 55.7, support 11,650.00, resistance 12,672.00. technical analysis of astrazeneca stock.

AstraZeneca shares on the LSE were last quoted at 12,428.00 GBp, down 0.99% on the day, according to Yahoo Finance data cited at 28 September 2026 14:00 WIB. The move leaves the stock above both its short- and medium-term averages, but not decisively so, which is why the chart still reads as a market in consolidation rather than a clean trend breakout.
Trend & Price Action
The first signal is that AstraZeneca remains in a sideways pattern, with the SMA20 at 12,178.20 and the SMA50 at 12,183.68 sitting almost on top of each other. That near overlap matters because it shows the stock has not built a strong directional bias; instead, it is trading in a narrow equilibrium where buyers and sellers are still testing each other. The fact that price is above the SMA20 is constructive, but the lack of a new MA-cross means the market has not generated a fresh trend signal.
The slope of the SMA20 is mildly positive at 0.68% over 5 days, which suggests the recent drift has improved, even if only modestly. As shown in the chart, the share price is also positioned at 76% of its 20-hour range, closer to the upper end than the lower one. That positioning usually indicates the market is willing to pay up near the top of the recent band, but it also leaves less room before overhead supply appears.
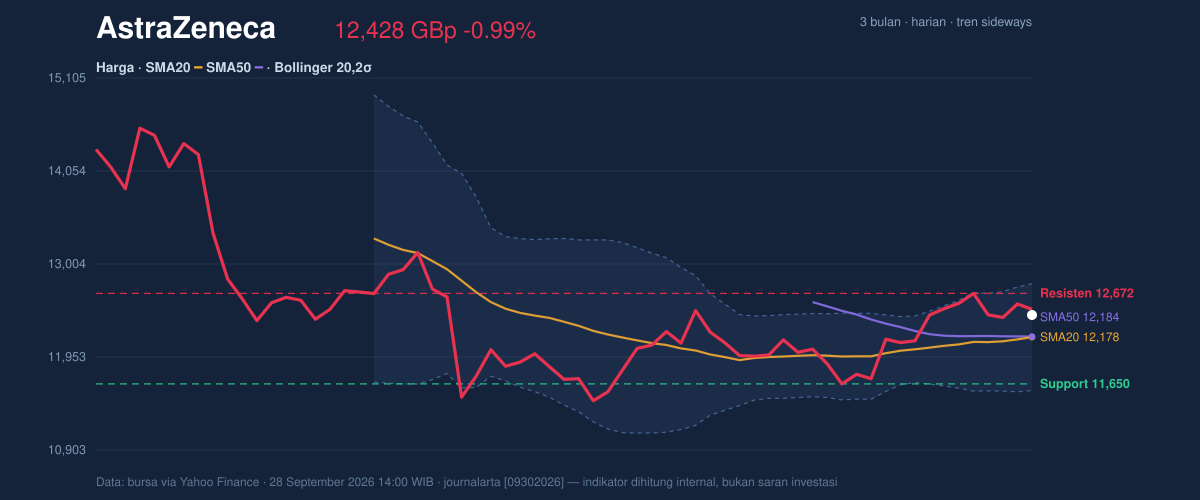
Range context reinforces that reading. The stock sits well below its 3-month high of 14,686.00, yet above the 3-month low of 9,892.00. In plain language, AstraZeneca has recovered from the lower part of its recent trading range, but it has not yet reclaimed enough ground to suggest a new upward leg is underway.
Oscillators & Momentum
The momentum picture is mixed, and that mix is important. The RSI at 55.7 is neutral, which means price strength is present but not stretched. That is the kind of reading that often accompanies a balanced market: neither exhausted sellers nor an aggressively overbought rally.
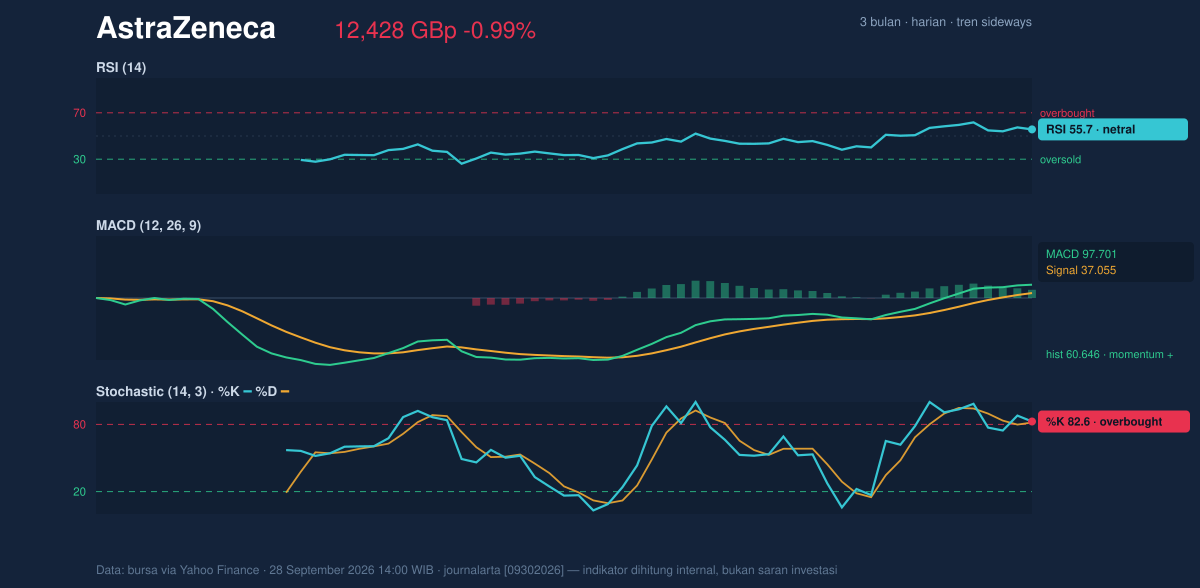
By contrast, the Stochastic %K at 82.6 and %D at 81.7 are both in overbought territory. This does not automatically mean the stock must fall; it means the recent rise has been fast enough that short-term traders may already be crowded into the move. When Stochastic is elevated while RSI is only neutral, it often signals a market that can stay firm, but is vulnerable to pauses or pullbacks if buying interest cools.
The strongest momentum confirmation comes from MACD. The MACD at 97.701 is well above its signal line at 37.055, with a histogram of 60.646. In practical terms, that means the underlying trend impulse is still positive, even if the price has not broken out of its sideways structure. The histogram being clearly positive shows the gap between momentum and its trigger line remains wide, which usually supports the idea that the stock has not yet lost its upward bias.
Volatility & Volume
Bollinger Bands add another layer of context. The upper band at 12,781.10 is not far above the current price, while the middle band at 12,178.20 sits almost exactly at the moving-average cluster. With %B at 71%, the shares are trading in the upper part of the band structure, which is consistent with a market leaning firm rather than weak. At the same time, the 9.9% band width is described as normal, so this is not a volatility squeeze that typically precedes a sharp expansion. It is a steady, contained setup.
ATR confirms that view. The ATR(14) of 269.16, equal to 2.2% of price, points to moderate daily movement rather than turbulence. That matters because it frames the likely scale of near-term swings: the stock can move, but not in a disorderly way unless a catalyst changes the tone.
Volume, however, is the main caution flag. Last volume of 1,550,979 is only 0.5× the 20-day average of 3,087,797, which means the latest price action is happening on light participation. That weakens the conviction behind the move above the moving averages. The one offset is that OBV is rising, suggesting cumulative buying pressure has been improving even while the latest session itself looked quiet. As shown in the chart, that combination often means the stock is being accumulated gradually rather than chased aggressively.
Key Levels & Scenarios
The nearest technical ceiling is the 12,672.00 resistance. That level matters because it sits just above the current price and near the upper Bollinger zone, so a move through it would be the first sign that buyers are willing to extend the range. On the downside, 11,650.00 support is the key floor to watch. It is the point where the recent range would start to look more fragile if price slips back below it.
Given the current setup, the market is still trading in a band, not a trend. If AstraZeneca can hold above the moving-average cluster and push through 12,672.00, the chart would improve materially. If it fails there, the stock may simply continue oscillating between support and resistance, with momentum indicators gradually cooling from overbought levels.
Technical Verdict: HOLD (wait & see)
HOLD (wait & see) is the clearest read from the current chart because the trend is constructive but not decisive, momentum is positive but partially stretched, and volume is too light to confirm a breakout.
- Reason 1: Price is above SMA20 and SMA50, but the averages are nearly flat and there is no new MA-cross, so trend confirmation is limited.
- Reason 2: MACD is positive and the histogram remains wide, which supports underlying strength.
- Reason 3: Stochastic is overbought while volume is only 0.5× average, which makes the current advance less convincing.
- Verdict invalidated if price breaks below 11,650.00, because that would damage the current range structure.
- Ideal Entry Range: 12,178.20 to 12,183.68, where the price sits on the SMA20/SMA50 cluster.
- Exit Target: 12,672.00, the nearest resistance; a secondary technical ceiling is 12,781.10, the upper Bollinger band.
- Stop Loss Protection: 11,650.00, the marked support level.
Summary Data AstraZeneca
| Last price | 12,428.00 GBp |
| Change 1 day / 5 days / 1 month | -0.99% / -1.05% / 3.83% |
| Trend / MA-cross | sideways / none |
| SMA20 / SMA50 | 12,178.20 / 12,183.68 |
| RSI (14) / Stochastic %K | 55.7 / 82.6 |
| Bollinger %B / ATR | 71% / 269.16 |
| Support / Resistance 20 days | 11,650.00 / 12,672.00 |
| Data as of | 28 September 2026 14:00 WIB |

