AIA Stock Technicals Today: Drops 0.20%, Testing Support Level
On September 30, 2026: price 73.90 HKD, trend sideways, RSI 41.4, support 73.75, resistance 77.50. technical analysis of aia stock. AIA Stock Technicals — full…

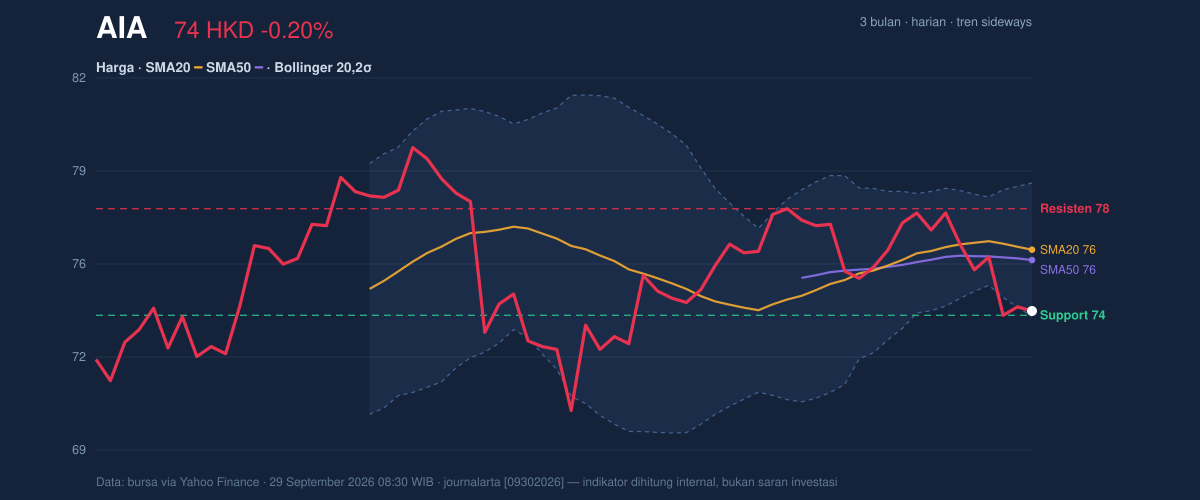
73.90 HKD is sitting just below the lower Bollinger band at 73.71 after a 0.20% daily dip, and that small move matters more than the size of the fall. It shows AIA Group is still trading in a weak short-term posture: price is below both the SMA20 at 76.06 and the SMA50 at 75.69, while the broader pattern remains sideways rather than decisively trending. The chart is also tightening, with Bollinger bands narrowing to a 6.2% width, which often means the market is compressing before a larger move rather than drifting forever.
Trend & Price Action
The stock’s location relative to its moving averages is the first signal to watch. Trading below the SMA20 and below the SMA50 tells you the recent pullback still has control, even though the market has not yet produced a fresh bearish crossover. In plain terms, the medium-term trend is not broken into a full downtrend, but it is leaning lower as the SMA20 slope of -0.24% over 5 days points to fading momentum. That is consistent with the 5-day decline of 3.08% and the 1-month drop of 2.70%.
As shown in the chart, the price is now close to the lower edge of the recent range. The 20-hour support at 73.75 is almost on top of the last price, which means the market is testing a level where buyers have recently tried to stabilise the shares. The 20-hour resistance at 77.50 sits well above current trading, so any rebound would need to reclaim lost ground before the chart improves materially. The bigger frame is still bounded by the 3-month high of 80.15 and 3-month low of 70.10, a range that shows AIA has not escaped the wider consolidation.
Oscillators & Momentum
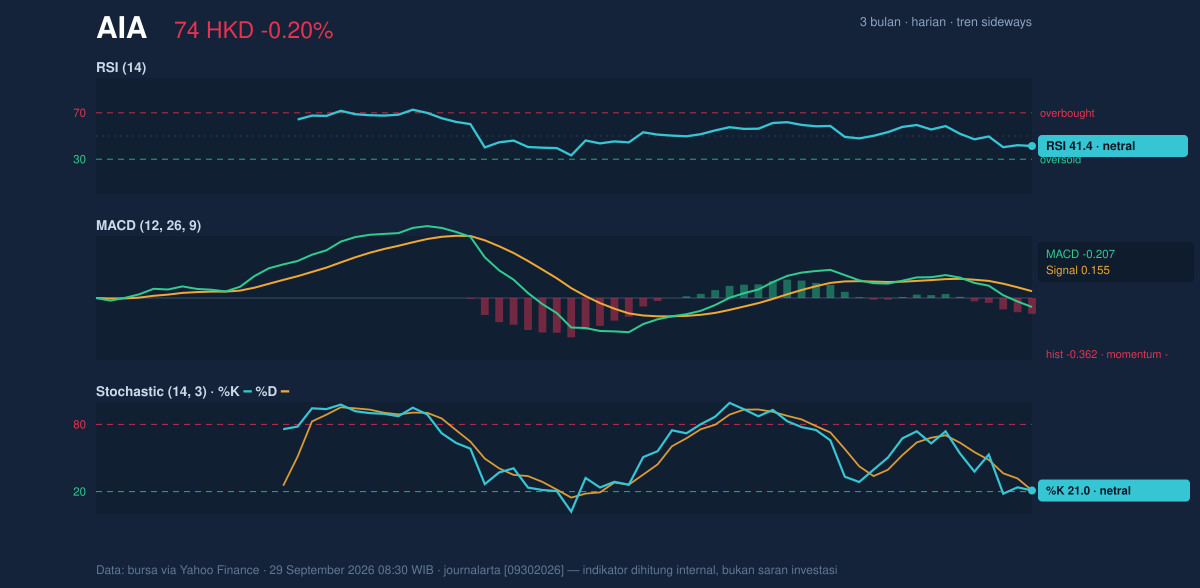
The momentum picture is mixed, but with a negative bias. The RSI at 41.4 is neutral, which means the stock is not oversold enough to signal panic buying, nor overbought enough to suggest stretched optimism. That matters because a neutral RSI near a weak price trend often says the market is drifting lower without strong emotional extremes. It is a softer kind of weakness, not a capitulation.
The Stochastic %K at 21.0 and %D at 21.0 are also neutral, but they are sitting low enough to show the stock is near the lower end of its short-term momentum band. In practice, that can be a setup for a bounce, but only if price actually starts to reclaim nearby resistance. The more important warning comes from MACD at -0.207 versus a signal line at 0.155, with a histogram of -0.362. That combination means downside momentum is still active: the faster trend measure is below the slower one, and the gap between them is negative. In other words, the market is not just weak; it is still losing speed on the upside.
Volatility & Volume
Volatility is not collapsing, but it is compressing. The ATR at 1.79, equal to 2.4% of price, suggests the stock is still capable of meaningful daily movement. Combined with the narrowing Bollinger bands, that creates a classic squeeze condition: the market is quiet enough to lull traders, but tight enough to be storing potential energy. The key signal here is not the quiet itself, but the fact that quiet is happening after a slide.
Volume adds another layer. Last trade volume of 39,605,950 was about 1.5× the 20-hour average of 26,400,483, so the move lower is not happening on thin participation. That makes the decline more credible. At the same time, OBV is falling, which means volume flow has been favouring distribution rather than accumulation. When price is near support but OBV is still down, it often signals that buyers have not yet proven they can absorb supply.
Key Levels & Scenarios
The most important immediate line is 73.75. Because the last price is only slightly below it, this level is effectively being tested in real time. If it holds, the market can attempt a rebound toward the middle Bollinger band at 76.06, which also matches the SMA20. That level is important because it is where short-term trend repair usually begins. If price can reclaim that band, the next visible ceiling is 77.50 resistance, and above that the upper Bollinger band at 78.40 becomes the next technical reference.
If 73.75 fails, the chart would expose the lower part of the broader range and reopen attention on the 70.10 three-month low. That would be a sign that the current squeeze resolved to the downside rather than into recovery. For now, the stock is still inside a compression zone, but the burden of proof sits with the buyers.
Technical Verdict: HOLD (wait & see)
HOLD (wait & see) is the cleanest read from the current setup. The reason is simple: price is below the SMA20 and SMA50, MACD remains negative, and OBV is still falling, all of which argue that momentum has not yet turned. At the same time, RSI is neutral and the Bollinger bands are squeezing, so the stock is not in a one-way breakdown either.
- Entry Range: 73.75 to 76.06, where support and the Bollinger/SMA20 midpoint overlap.
- Exit Target: 77.50, with 78.40 as the upper band reference if strength extends.
- Stop Loss protection: below 73.75, with 70.10 as the deeper invalidation zone.
The technical message is that AIA is compressed, weak, and waiting for a directional break rather than already in recovery. Verdict invalidated if price breaks below 73.75.
For non-traders, that means the shares are close to a make-or-break support level, and the next move will matter more than the small day-to-day drift.
Source: HKEX via Yahoo Finance, 29 September 2026 08:30 WIB.
Summary Data AIA
| Last price | 73.90 HKD |
| Change 1 day / 5 days / 1 month | -0.20% / -3.08% / -2.70% |
| Trend / MA-cross | sideways / none |
| SMA20 / SMA50 | 76.06 / 75.69 |
| RSI (14) / Stochastic %K | 41.4 / 21.0 |
| Bollinger %B / ATR | 4% / 1.79 |
| Support / Resistance 20 days | 73.75 / 77.50 |
| Data as of | 29 September 2026 08:30 WIB |

