OCBC Stock Drops 0.19%, Testing Key Resistance In Focus
On September 30, 2026: price 32.16 SGD, trend uptrend, RSI 60.6, support 31.00, resistance 32.27. technical analysis of ocbc stock. OCBC Stock Drops — full…

OCBC Bank edged down to SGD 32.16 on SGX, slipping 0.19% from the previous close of 32.22 even as the broader structure remains constructive. The stock is still trading above its short-term average, but the latest tape shows a market that is no longer accelerating; instead, it is pausing near the top of its recent range, where traders often start to test whether momentum can extend or whether profit-taking will cap the move.
Trend & Price Action
The main signal in the chart is that OCBC remains in an uptrend, with the SMA20 at 31.70 rising at 0.53% over five days. That matters because a rising short-term average usually means buyers have been willing to pay progressively higher prices, not just defend a static level. With the share price still above the SMA20 and the SMA50 at 30.83 below both, the medium-term structure still leans positive, even though there is no new MA-cross to signal a fresh acceleration.
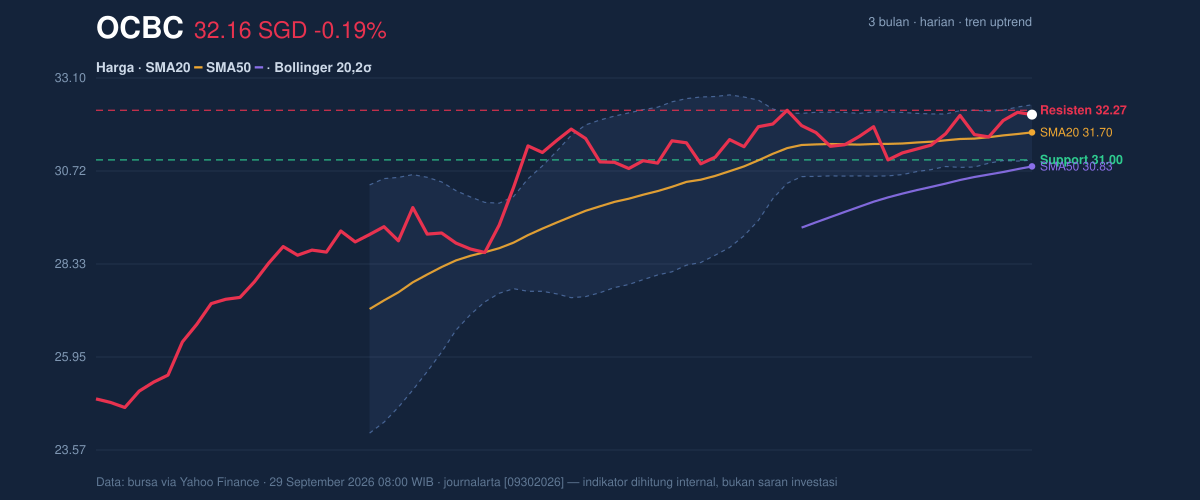
The price is also sitting at 91% of its 20-hour range, which tells us it is trading close to the upper end of recent intraday action. That positioning is important: it usually reflects strength, but it also means the market has less room to run before meeting resistance. The nearest ceiling is 32.27, just above the last price, while the broader 3-month high at 32.57 shows the stock is approaching a prior peak rather than breaking into open space. In plain terms, OCBC is strong, but it is now asking the market to prove that strength again.
Oscillators & Momentum
Momentum is more mixed than the trend line suggests. The RSI at 60.6 is still in neutral territory, which means the stock is not yet in the kind of stretched condition that often precedes a sharp reversal. But the Stochastic readings of 86.1 and 87.3 are in overbought territory, indicating the recent rise has been fast enough that short-term buyers may already be crowded in. That does not automatically mean the price must fall; it means the stock is vulnerable to hesitation if fresh demand does not continue to show up.
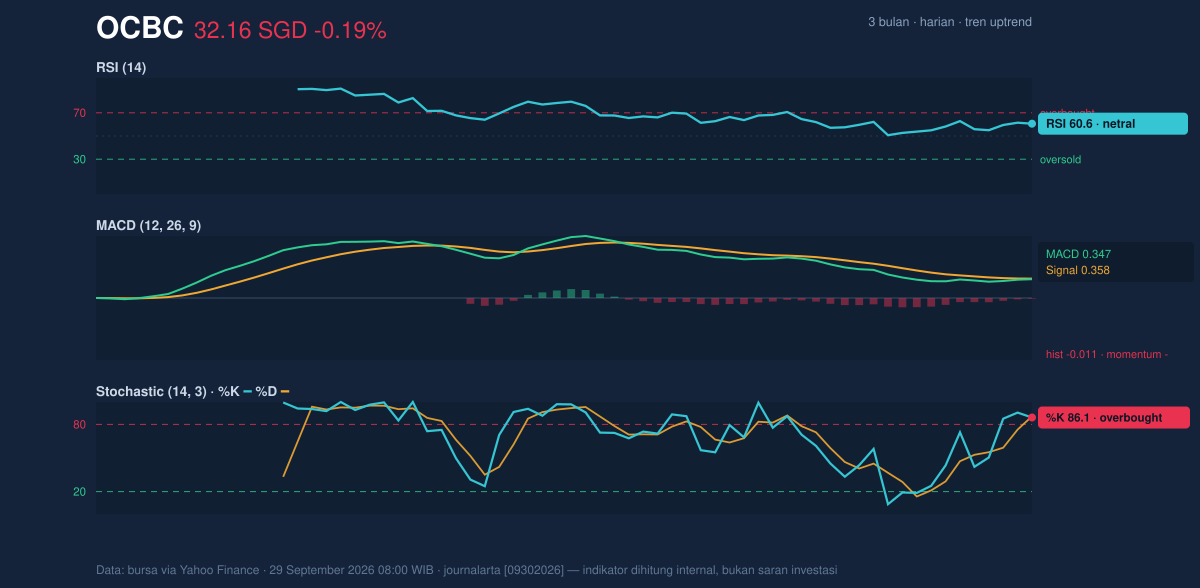
The more cautionary signal comes from the MACD at 0.347, still above zero but below its signal line at 0.358, leaving a -0.011 histogram. In practical terms, MACD is saying the trend is still positive, but the pace of that trend has weakened slightly. When MACD softens while price remains near the upper band, it often points to consolidation rather than immediate continuation. That is a subtle but important distinction: the stock can stay in an uptrend while momentum cools underneath.
Volatility & Volume
Volatility is unusually restrained for a stock pressing toward the top of its range. The ATR(14) at 0.47, equal to 1.4% of price, suggests daily movement has been relatively contained. At the same time, the Bollinger Bands are narrowing, with the band width at 4.5%, a classic squeeze pattern that often precedes a larger move. The key point is not the squeeze itself, but what it implies: compression tends to store up energy, and the next expansion can be sharp once price chooses a direction.
Price is also trading near the upper band, with %B at 82% and the upper Bollinger line at 32.41. That means OCBC is closer to the top of its statistical envelope than the middle, which reinforces the idea that the market is testing resistance rather than drifting aimlessly. Volume adds a modest confirmation: the latest 6,402,000 shares traded versus a 20-hour average of 5,775,690, or about 1.1x normal. That is not a surge, but it is enough to show participation rather than apathy. The rising OBV also supports the view that accumulation has been more persistent than distribution, even if the last session’s price change was small.
Key Levels & Scenarios
The immediate technical map is fairly clear. Support at 31.00 is the first line that matters, because it aligns with the lower Bollinger band and sits below the rising short-term average. If price holds above that area, the uptrend remains intact and the current pause can be read as consolidation. If it fails, the chart would likely shift from “pause within trend” to “trend under pressure.”
On the upside, 32.27 is the first resistance to watch, followed by the 32.41 Bollinger upper band and then the 32.57 3-month high. A clean move through those levels would signal that the squeeze is resolving to the upside and that the stock is no longer merely pressing against the range ceiling. For now, the burden is on buyers to convert proximity into breakout confirmation.
Technical Verdict: HOLD (wait & see)
HOLD (wait & see)
- Trend remains positive: price is above the SMA20 at 31.70 and SMA50 at 30.83, with the short-term average still rising.
- Momentum is cooling: Stochastic is overbought and MACD is slightly below signal, which argues for patience rather than chasing strength.
- Volatility is compressed: the Bollinger squeeze suggests a larger move may be coming, but direction is not yet confirmed.
Verdict invalidated if price breaks below 31.00.
- Ideal Entry Range: 31.70 to 31.00
- Exit Target: 32.27 to 32.57
- Stop Loss protection: below 31.00
For non-traders, that means the stock still looks firm, but the chart is waiting for either a breakout above resistance or a slip back toward support before the next clear move. The next scheduled technical test is the market’s reaction around 32.27 and 32.41 on the next session.
Summary Data OCBC
| Last price | 32.16 SGD |
| Change 1 day / 5 days / 1 month | -0.19% / 0.06% / 2.62% |
| Trend / MA-cross | uptrend / none |
| SMA20 / SMA50 | 31.70 / 30.83 |
| RSI (14) / Stochastic %K | 60.6 / 86.1 |
| Bollinger %B / ATR | 82% / 0.47 |
| Support / Resistance 20 days | 31.00 / 32.27 |
| Data as of | 29 September 2026 08:00 WIB |

