Tencent Momentum Gains: Stock Drops 1.77% (September 30, 2026)
On September 30, 2026: price 432.00 HKD, trend downtrend, RSI 46.3, support 419.00, resistance 451.60. technical analysis of tencent stock.

Tencent Holdings fell on the Hong Kong exchange on 29 September 2026, with 0700.HK last trading at 432.00 HKD after a 1-day drop of 1.77%, as the stock slipped back below its short-term average and stayed pinned in the lower half of its recent range. The move matters because it shows a market that is not in freefall, but is still struggling to reclaim control after a weak week and month: price is below the 20-day trend line, yet momentum has not fully rolled over. In plain terms, Tencent is being pulled by a mild downtrend, while a few internal indicators are still trying to stabilize.
Trend & Price Action
The chart shows Tencent trading at 432.00 HKD, below its SMA20 at 434.65 and well under the SMA50 at 448.18. That positioning is important: when price sits beneath both short- and medium-term averages, it usually signals that recent buyers have not yet regained the upper hand. The SMA20 slope of -0.63% over 5 days confirms that the near-term trend is still pointing down, even if only gradually. There is no fresh MA crossover, which means the chart has not produced a decisive trend reversal signal; instead, it remains in a waiting pattern where price is leaning lower but not collapsing.
The stock is also trading in the lower part of its recent band, at about 40% of the 20-hour range between 419.00 support and 451.60 resistance. That location suggests the market is close enough to support to attract attention, but not yet strong enough to reclaim the upper boundary. The broader three-month range, from 415.00 to 497.80, frames the current pullback as a retreat inside a much wider consolidation.
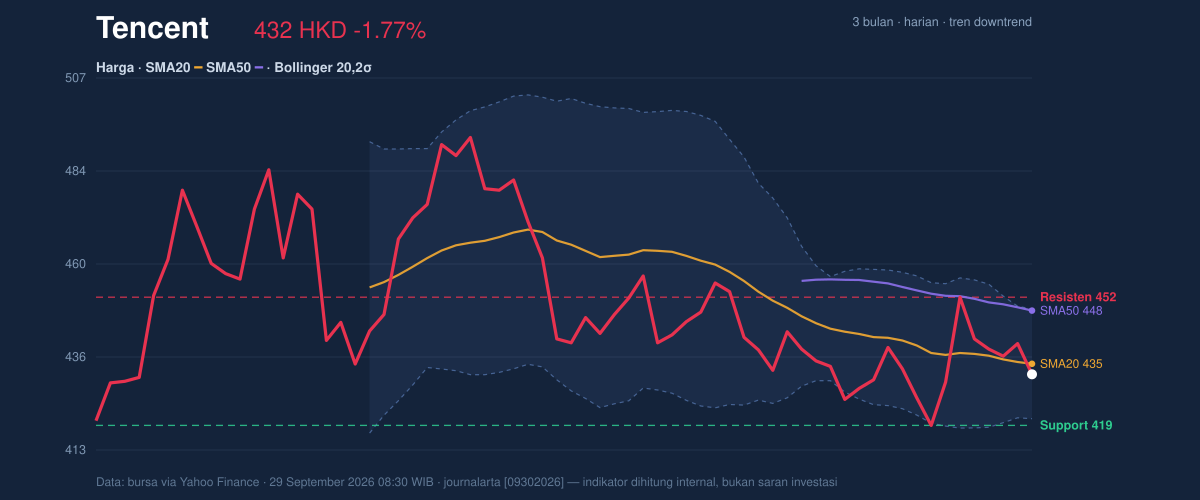
A short line tells the story: the stock is weak, but not broken.
Oscillators & Momentum
The momentum picture is more balanced than the price trend. RSI(14) at 46.3 is neutral, which means the stock is neither stretched on the upside nor deeply washed out on the downside. That matters because a neutral RSI after a decline often suggests selling pressure has eased, even if buyers have not yet taken control. The Stochastic %K at 29.3 and %D at 38.6 also sits in neutral territory, but it leans closer to the lower end of the scale, which can indicate the stock is approaching an area where short-term downside momentum starts to soften.
The most interesting signal comes from MACD. MACD at -2.753 remains below zero, so the broader momentum backdrop is still negative, but it is trading above the signal line at -3.928 with a histogram of 1.174. That configuration usually means downside momentum is losing force, even if the trend has not yet turned up. In other words, the stock is not showing a clean reversal; it is showing an early attempt to stabilize inside a still-weak structure.
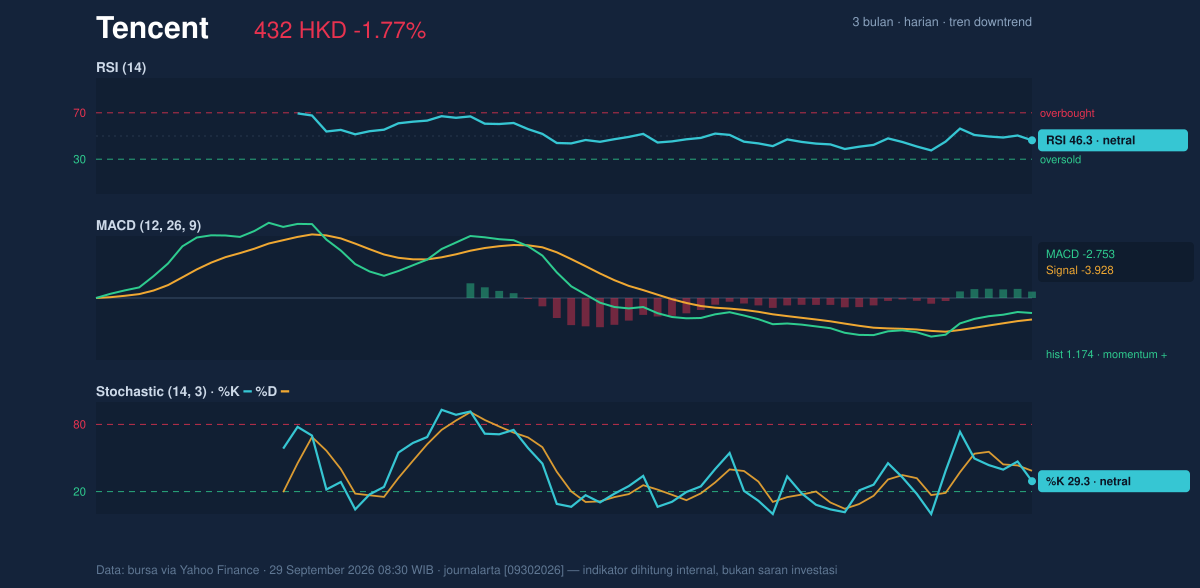
That is the key tension: price says downtrend, momentum says the decline may be tiring.
Volatility & Volume
Bollinger Bands add another layer. Tencent’s price is sitting below the middle band at 434.65 but above the lower band at 420.70, with %B at 41%. That places the stock in the lower-middle zone of the band structure, not at an extreme. More important is the 6.4% band width, which is narrowing. A squeeze like this often means the market is compressing energy before a larger move. It does not tell direction by itself, but it does warn that the current quiet may not last.
ATR(14) at 12.46, or 2.9% of price, points to moderate volatility. That is consistent with a stock that is moving enough to matter, but not enough to look disorderly. Volume, however, is not giving the bulls much help. Last volume came in at 18,015,236, below the 20-day average of 19,974,239, and OBV is falling. That combination matters because a price bounce without volume support often struggles to hold. Falling OBV means the balance of traded volume has been leaning toward distribution rather than accumulation.
The signal is subtle but clear: compression is building, yet participation is not confirming strength.
Key Levels & Scenarios
The immediate support at 419.00 is the first level that matters. If price holds above it, Tencent can continue to base inside the current squeeze and attempt a move back toward the middle band and short-term average. If that floor gives way, the chart opens the door toward the broader 3-month low of 415.00, which would deepen the technical damage and reinforce the downtrend.
On the upside, resistance at 451.60 is the first clear ceiling. That sits above the SMA20 at 434.65 and below the SMA50 at 448.18, so a move through it would require the stock to reclaim both trend and momentum territory. The Bollinger upper band at 448.60 sits close to that zone, which makes the area between 448 and 452 a meaningful test of whether the squeeze resolves upward. If price can hold above the middle band and then push through resistance, the chart would begin to repair.
Technical Verdict: HOLD (wait & see)
Tencent’s chart is caught between a downtrend in price structure and improving MACD momentum, while RSI and Stochastic remain neutral and the Bollinger Bands are tightening. The lack of a fresh MA crossover and the falling OBV argue against calling the setup resolved in either direction yet.
- Entry Range: 419.00 to 434.65, where support and the SMA20 cluster
- Exit Target: 448.60 to 451.60, aligned with the upper Bollinger band and resistance
- Stop Loss protection: below 419.00, with 415.00 as the deeper invalidation zone
- Verdict invalidated if price breaks below 419.00, because that would expose the 415.00 low and confirm renewed downside pressure
For non-traders: Tencent looks like a stock that is pausing near support, but it has not yet proved that the decline is over.
“If 419.00 fails, the chart stops being a pause and starts looking like a warning.”
Summary Data Tencent
| Last price | 432.00 HKD |
| Change 1 day / 5 days / 1 month | -1.77% / -4.34% / -2.13% |
| Trend / MA-cross | downtrend / none |
| SMA20 / SMA50 | 434.65 / 448.18 |
| RSI (14) / Stochastic %K | 46.3 / 29.3 |
| Bollinger %B / ATR | 41% / 12.46 |
| Support / Resistance 20 days | 419.00 / 451.60 |
| Data as of | 29 September 2026 08:30 WIB |

