Alibaba Stock Analysis: Drops 1.39%, Testing Support Level
On September 30, 2026: price 106.20 HKD, trend downtrend, RSI 41.8, support 105.10, resistance 114.80. technical analysis of alibaba stock.

Alibaba Group’s Hong Kong-listed shares slipped to HKD 106.20 on the HKEX, down 1.39% from the previous close of HKD 107.70, as the stock continued to trade below its short- and medium-term moving averages, a sign that sellers still control the tape even as some momentum gauges begin to stabilize.
Trend & Price Action
The chart shows a stock that is still in a downtrend, with the SMA20 at HKD 108.70 and the SMA50 at HKD 114.85 both sitting above the current price. That matters because moving averages are often watched as trend filters: when price stays below them, rallies tend to be treated as recovery attempts rather than a confirmed reversal. The SMA20 slope of -1.29% over 5 days reinforces that the near-term trend is still pointing lower, and the lack of a fresh MA cross suggests there is no new bullish signal from the trend structure yet.
The price is also positioned near the lower half of its recent range. With support at HKD 105.10 and resistance at HKD 114.80, the stock is trading at roughly 11% of the range, which places it close to the floor rather than the ceiling. That usually means the market is testing whether recent weakness has run far enough to attract buyers, but it does not yet mean the decline has ended.
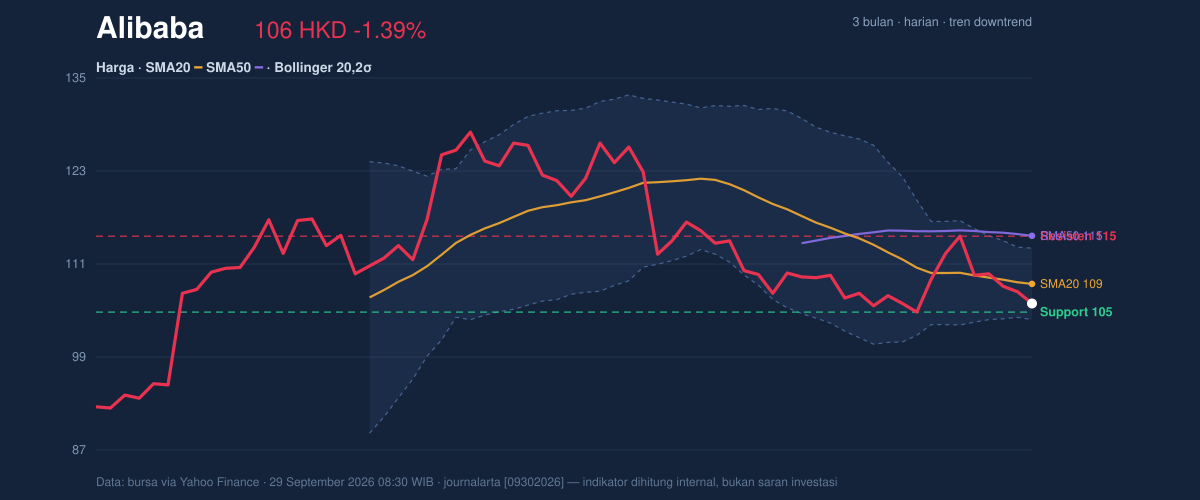
A clean break below nearby support would shift attention to the lower Bollinger band and the broader 3-month low area.
That is the line the market is watching.
Oscillators & Momentum
The momentum picture is mixed, which is important because it explains why the stock can still be weak on trend while showing signs of exhaustion. The RSI at 41.8 is neutral, not oversold enough on its own to imply a strong rebound, but low enough to show that downside pressure has already cooled from more aggressive levels. More telling is the Stochastic %K at 14.2 versus %D at 22.9: that sits in oversold territory and suggests short-term selling may be stretched. In plain terms, the stock has been falling fast enough that it may be due for a pause or bounce, even if the broader trend has not turned.
The MACD at -1.537 remains below zero, which means the longer trend momentum is still negative, but the histogram at 0.092 is positive and the MACD line is above the signal line at -1.629. That combination often signals that downside momentum is fading before price itself turns. It is not a reversal confirmation; it is a warning that the selling force may be losing intensity.
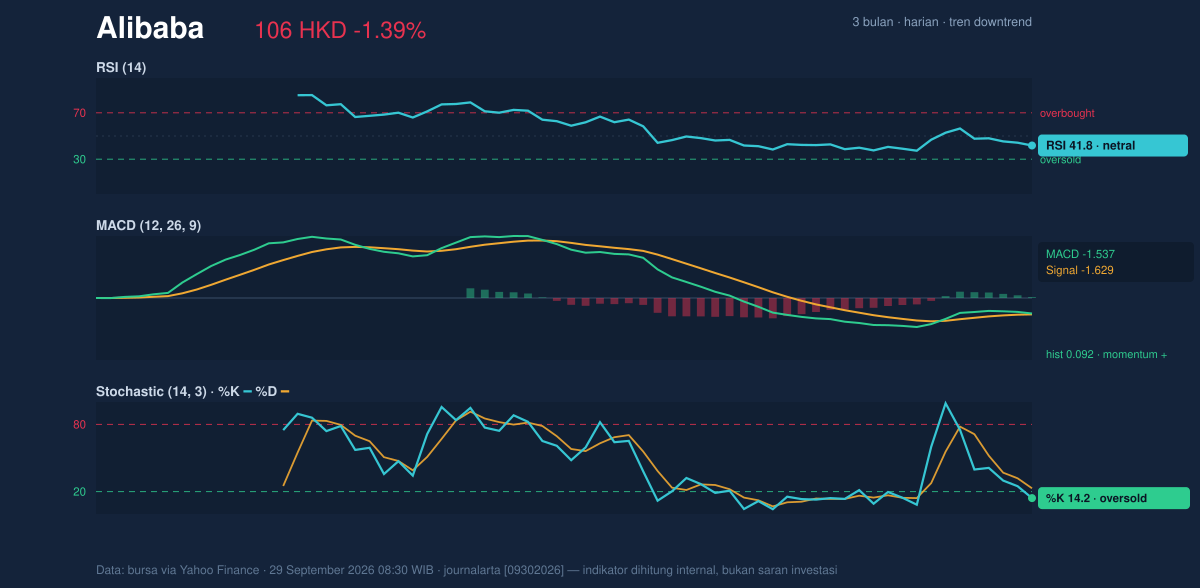
In short, the oscillators are starting to lean less bearish than the price chart.
That divergence deserves attention.
Volatility & Volume
The Bollinger Bands help frame how far the stock has already moved. With the lower band at HKD 104.13, the price at HKD 106.20 sits just above the lower edge, while %B at 23% shows the share price is trading in the lower quarter of the band structure. That usually indicates depressed positioning rather than strength. The band width of 8.4% is described as normal, so this is not a squeeze setup that would typically precede a sharp breakout on its own. Instead, the market appears to be in a standard volatility environment where direction will likely depend on whether support holds or fails.
The ATR(14) at 3.54, equal to 3.3% of price, points to moderate daily movement. That is significant because it means the stock can still travel a meaningful distance in either direction without requiring an unusual catalyst. Volume also matters here: the latest print of 57,027,476 was slightly below the 20-day average of 60,343,865, or 0.9x normal. Lower-than-average turnover during a decline can mean the move is not being forced by panic selling, but it can also mean buyers have not yet stepped in with conviction.
The one constructive signal in this section is OBV rising, which suggests cumulative volume flow has been improving even while price remains weak.
That is often the first hint that selling pressure is tiring.
Key Levels & Scenarios
The immediate technical map is straightforward. HKD 105.10 is the key support to watch, while HKD 114.80 is the first meaningful resistance. The stock is also boxed in by the Bollinger structure, with the lower band at HKD 104.13 and the middle band at HKD 108.70, which is the same as the SMA20. That overlap is important: reclaiming the middle band would be the first sign that the market is trying to shift from defensive to neutral.
If price holds above HKD 105.10 and starts to recover toward HKD 108.70, the market could attempt a move back toward HKD 113.27 and then HKD 114.80. If HKD 105.10 fails, the lower Bollinger band at HKD 104.13 becomes the next reference, and a deeper slide would reopen the path toward the 3-month low of HKD 91.15. On the upside, the 3-month high of HKD 130.30 remains distant and would only matter if the stock first recovers the moving averages and resistance cluster.
Technical Verdict: HOLD (wait & see)
HOLD (wait & see) is the clearest technical reading because the chart is still in a downtrend, but momentum is no longer uniformly negative.
- Reason 1: Price remains below the SMA20 at HKD 108.70 and SMA50 at HKD 114.85, so the trend has not turned up.
- Reason 2: Stochastic is oversold and the MACD histogram is positive, which suggests downside momentum is fading.
- Reason 3: OBV is rising even though volume is slightly below average, hinting that accumulation may be building.
Verdict invalidated if price breaks below HKD 105.10, because that would confirm support failure and raise the risk of a move toward the lower band and beyond.
- Ideal Entry Range: HKD 105.10 to HKD 108.70
- Exit Target: HKD 113.27 to HKD 114.80
- Stop Loss protection: below HKD 104.13
For non-traders: the stock is weak, but it is also approaching a zone where sellers may be getting tired.
Summary Data Alibaba
| Last price | 106.20 HKD |
| Change 1 day / 5 days / 1 month | -1.39% / -7.49% / -3.80% |
| Trend / MA-cross | downtrend / none |
| SMA20 / SMA50 | 108.70 / 114.85 |
| RSI (14) / Stochastic %K | 41.8 / 14.2 |
| Bollinger %B / ATR | 23% / 3.54 |
| Support / Resistance 20 days | 105.10 / 114.80 |
| Data as of | 29 September 2026 08:30 WIB |

