Alibaba Testing Support Level: Stock Drops 2.06% (Oktober 5, 2026)
On Oktober 5, 2026: price 104.40 HKD, trend downtrend, RSI 39.3, support 104.40, resistance 114.80. technical analysis of alibaba stock.

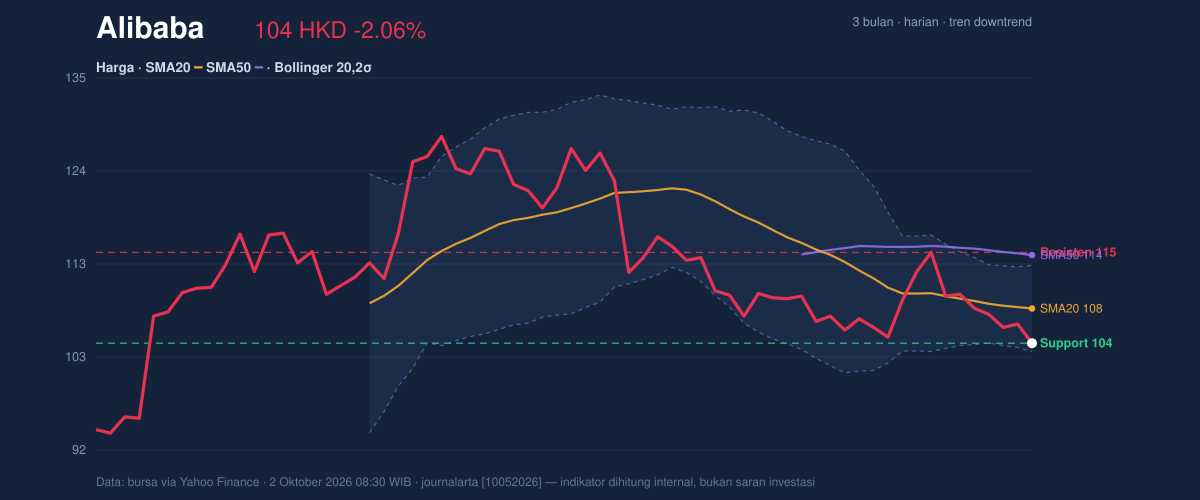
Alibaba Group’s shares on HKEX fell to HKD 104.40 on 2 October 2026, down 2.06% from the previous close, as the stock stayed pinned near the bottom of its recent trading range and below key trend lines. The move matters because it shows sellers still control the tape even though some short-term momentum gauges are already stretched to the downside. The chart, as shown in the price action panel, places the stock just above the lower Bollinger band and below the 20-day average, a combination that often signals pressure has not yet fully eased.
Trend & Price Action
Alibaba remains in a clear downtrend, with the SMA20 at HKD 108.38 sloping lower by 1.03% over 5 days and the SMA50 at HKD 114.50 sitting well overhead. That gap between price and moving averages is important: it tells readers the recent decline is not just a one-day dip but part of a broader softening in trend structure. Price is trading below the SMA20, and there is no fresh MA-cross to suggest a reversal signal has formed. In plain language, the stock has not yet reclaimed enough ground to argue that buyers have taken back control.
The range position is also weak. The latest print sits at 0% of the 20-hour range, with support at HKD 104.40 and resistance at HKD 114.80. That means the stock is effectively sitting on support rather than bouncing away from it, which raises the risk that any further selling could test the lower end of the broader 3-month range of HKD 92.50 to HKD 130.30.
The stock is still under pressure.
Oscillators & Momentum
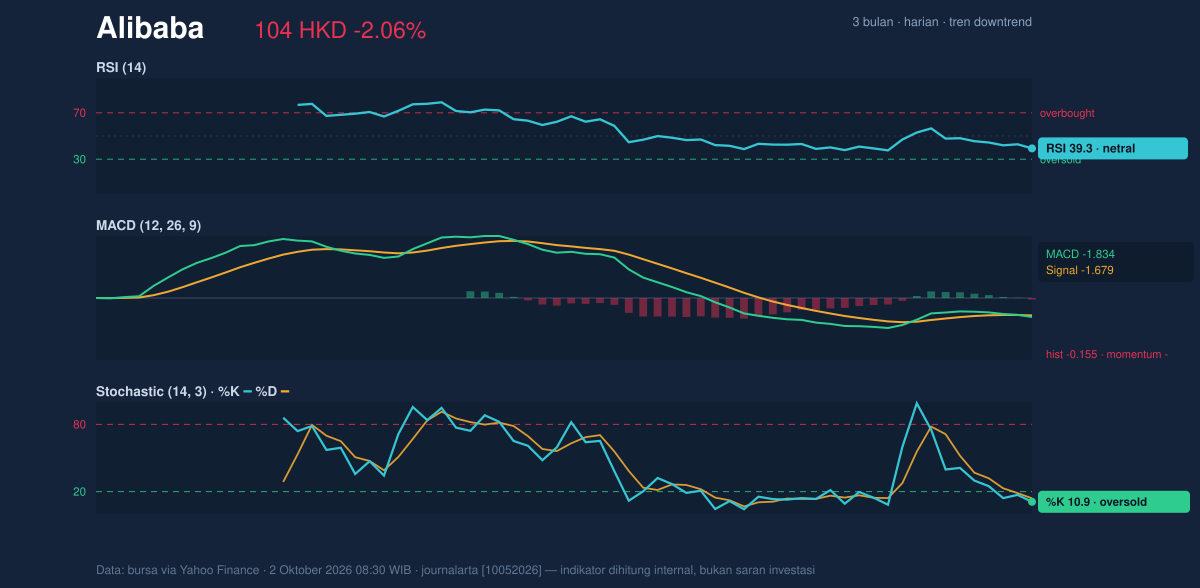
The momentum picture is mixed, but not yet constructive. The RSI at 39.3 is still neutral rather than oversold, which means the stock is weak but not necessarily washed out. By contrast, the Stochastic %K at 10.9 and %D at 14.0 are in oversold territory, showing the recent slide has become fast enough to leave the stock technically stretched. That often hints at a possible pause or rebound attempt, but oversold conditions alone do not reverse a downtrend; they only show the selling may be getting tired.
The MACD at -1.834, below its signal line at -1.679, keeps the momentum signal negative. The histogram at -0.155 shows the gap remains in bearish territory, meaning downside momentum is still active even if it is not accelerating sharply. In chart terms, the oscillator panel suggests the stock is weak enough to be vulnerable, but not yet strong enough to confirm a sustained turn.
Momentum is stretched, not repaired.
Volatility & Volume
Volatility is present but not extreme. The ATR(14) at 3.44, equal to 3.3% of price, indicates a moderately active market where daily swings can still matter, but not in the kind of disorderly way that usually accompanies panic selling. The Bollinger setup is more revealing: price is sitting near the lower band at HKD 103.43, with %B at 10%. That means the stock is trading very close to the bottom of its recent volatility envelope, a sign of downside exhaustion risk, but also a warning that the market has not yet reclaimed the middle band at HKD 108.38.
The Bollinger band width of 9.1% is described as normal, which matters because it suggests this is not a volatility squeeze waiting for an explosive break. Instead, the chart is showing a controlled drift lower with room for either a technical bounce or another leg down if support gives way. Volume adds nuance: the latest turnover of 39,772,509 shares was only 0.7x normal versus the 20-session average of 57,374,962. That lower-than-usual volume can mean the latest drop lacked strong conviction from the broader market, but it can also mean buyers are not stepping in aggressively. The OBV is rising, which is the one encouraging participation signal here because on-balance volume tracks whether money flow is quietly improving even when price remains weak.
This is a fragile setup, not a clean reversal.
Key Levels & Scenarios
The immediate level to watch is HKD 104.40, which is both the last price and the current support marker. If that floor fails, the next reference points are the lower Bollinger band at HKD 103.43 and then the wider 3-month low area at HKD 92.50. On the upside, the first meaningful recovery signal would be a move back above the SMA20 at HKD 108.38, because that would show price is re-entering the middle of its recent range rather than hugging the downside edge. Above that, the next resistance sits at HKD 114.80, with the SMA50 at HKD 114.50 acting as a nearby technical ceiling.
What the chart is saying is simple: the stock is close to support, but it has not yet proven that support can hold. If price can reclaim the 20-day average, the tone improves; if it cannot, the broader downtrend stays intact.
Technical Verdict: HOLD (wait & see)
HOLD (wait & see)
- RSI at 39.3 is neutral, while Stochastic at 10.9/14.0 is oversold, so the stock is weak but not yet showing a confirmed reversal.
- MACD at -1.834 remains below its signal line, keeping momentum negative even as OBV rises.
- Price is still below SMA20 at HKD 108.38 and SMA50 at HKD 114.50, so trend confirmation has not improved.
- Verdict invalidated if price breaks below HKD 103.43.
- Ideal Entry Range: HKD 103.43 to HKD 108.38
- Exit Target: HKD 114.50 to HKD 114.80
- Stop Loss protection: below HKD 103.43
In plain English: the chart is weak, but it is close enough to support that traders may want to wait for proof either way.
Summary Data Alibaba
| Last price | 104.40 HKD |
| Change 1 day / 5 days / 1 month | -2.06% / -5.09% / -2.88% |
| Trend / MA-cross | downtrend / none |
| SMA20 / SMA50 | 108.38 / 114.50 |
| RSI (14) / Stochastic %K | 39.3 / 10.9 |
| Bollinger %B / ATR | 10% / 3.44 |
| Support / Resistance 20 days | 104.40 / 114.80 |
| Data as of | 2 Oktober 2026 08:30 WIB |
Track Alibaba share price daily: live levels, support/resistance and our full Alibaba analysis history.


