DBS Stock Analysis: Drops 0.19%, Testing Support Level
On Oktober 5, 2026: price 77.21 SGD, trend sideways, RSI 51.5, support 76.75, resistance 78.47. technical analysis of dbs stock. DBS Stock Analysis — full…

DBS Group Holdings is trading at 77.21 SGD, down 0.19% from the previous close of 77.36, with the share now sitting in the middle-lower part of its recent range as investors weigh a technically mixed setup. The stock is still above its 50-day moving average at 76.47, but it remains below the 20-day moving average at 77.49, a small but important signal that short-term momentum has softened even though the broader trend has not broken down. As shown in the chart, the immediate picture is not one of a clean breakout or breakdown, but of a market waiting for direction.
Trend & Price Action
The chart shows DBS in a sideways trend, and that matters because sideways phases often act like compression zones: price is balancing between buyers who defend dips and sellers who fade rallies. The SMA20 slope is flat at 0.00% over 5 days, which tells us the short-term average is not pointing decisively higher or lower. That kind of flattening often appears before a larger move, but it does not tell you the direction on its own.
The fact that price is below the SMA20 but still above the SMA50 puts DBS in a neutral-to-mildly cautious technical position. In plain English: the stock has not lost its medium-term floor, but it has also not reclaimed enough short-term strength to suggest fresh upside momentum. The 3-month high at 79.05 and 3-month low at 65.43 frame the broader range, with the current price closer to the upper half of that band, though not near enough to the high to imply a strong trend.
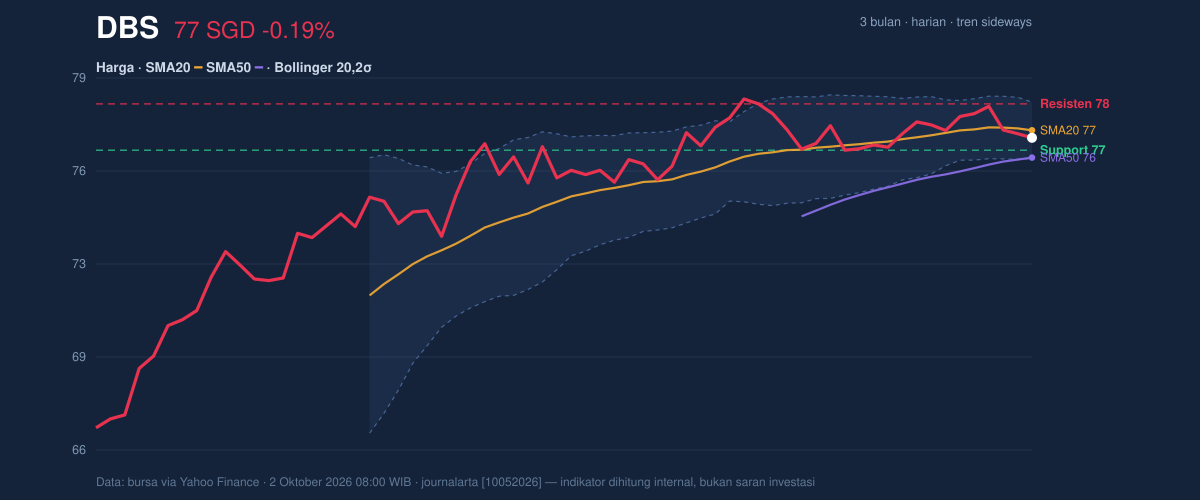
The nearest support at 76.75 is close enough to matter immediately. A decisive hold there would keep the current range intact. A failure there would expose the lower side of the recent structure.
Oscillators & Momentum
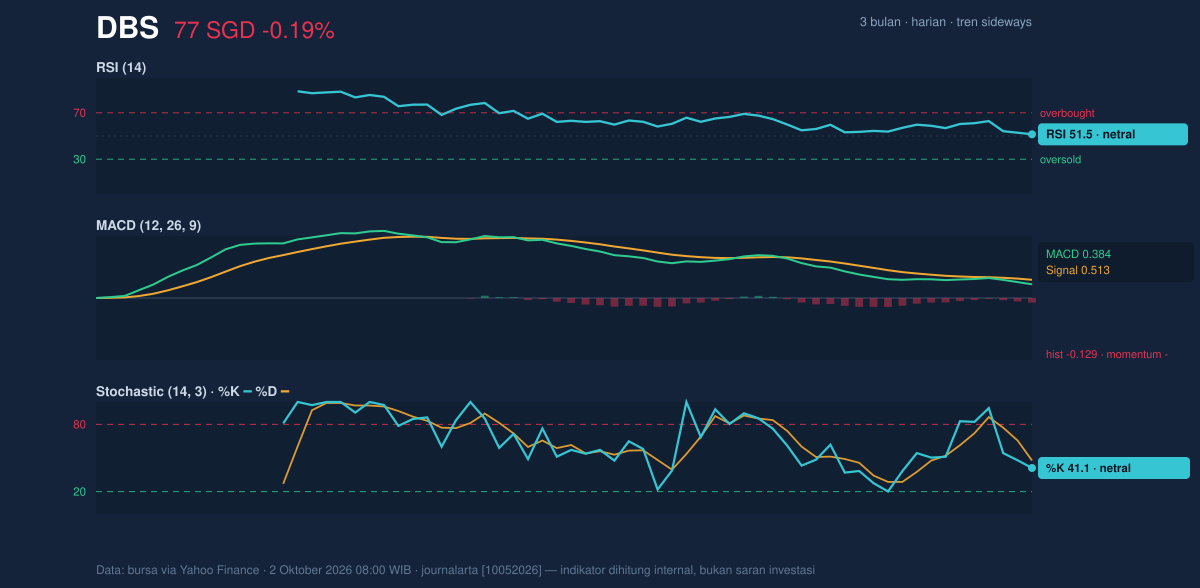
Momentum is mixed, and that is the clearest message from the indicators. The RSI at 51.5 is neutral, meaning DBS is neither stretched nor washed out. That is not a bearish reading by itself; it simply says the stock has room to move either way without first needing to “cool off” from an extreme. The Stochastic %K at 41.1 and %D at 47.8 are also neutral, but with %K below %D, the short-term rhythm is slightly softer than it was.
The more cautionary signal comes from the MACD. With MACD at 0.384, signal at 0.513, and histogram at -0.129, the model is saying the recent pace of price movement has slowed below its trend baseline. That negative histogram is the key: it does not mean the trend is broken, but it does mean upside momentum is losing altitude. In technical terms, the stock is still afloat, but the engine is not accelerating.
The chart’s momentum panel helps explain why the price has drifted rather than surged.
Volatility & Volume
Volatility is subdued. The ATR(14) at 0.90, or 1.2% of price, indicates relatively low daily movement. Low ATR often accompanies consolidation, and combined with the 2.7% Bollinger Band width, it suggests the stock is in a compression phase. That is what traders often call a squeeze: price action narrows, and the market stores energy for a larger move later. The important point is that a squeeze is not directional by itself; it simply means the next notable move could be more forceful than the recent drift.
The %B at 37% places DBS below the middle of the Bollinger envelope but not near the lower band. That tells us price is leaning to the softer side of the range without being technically oversold. The upper band at 78.54 and lower band at 76.44 give a tight corridor, and the stock’s position near the lower half of that corridor fits the softer MACD reading.
Volume adds one more layer. Last volume was 4,524,700, above the 20-day average of 3,732,574, or about 1.2× normal. That sounds supportive, but the OBV is down, which is more important. On-balance volume tracks whether volume is flowing into strength or weakness, and a falling OBV says participation has not been convincingly backing up price. In short: there is activity, but not enough accumulation to call it healthy demand.
Key Levels & Scenarios
The immediate map is tight. Support at 76.75 aligns closely with the Bollinger lower band at 76.44, so that zone is the first test for buyers. If price holds there and then pushes back through the SMA20 at 77.49, the chart would start to look more constructive, because reclaiming the short-term average often signals that recent weakness was only a pause.
On the upside, resistance at 78.47 sits just below the Bollinger upper band at 78.54. That makes it a practical ceiling in the current setup. A move through that area would suggest the squeeze is resolving upward and that the stock is escaping the center of its recent range. Until then, the market remains boxed in.
The location of price at 27% of the 20-day range also matters. It shows DBS is trading closer to support than resistance, which gives the downside more immediate relevance than the upside, even if the broader trend remains sideways rather than outright weak.
Technical Verdict: HOLD (wait & see)
HOLD (wait & see)
- RSI at 51.5 and Stochastic at 41.1 / 47.8 are neutral, so momentum is not strong enough to justify a directional call.
- MACD histogram at -0.129 shows momentum is fading, while the price is below SMA20 at 77.49, keeping short-term pressure slightly negative.
- The Bollinger Band width at 2.7% and ATR at 0.90 point to a squeeze, meaning the chart is compressed but not yet resolved.
- Verdict invalidated if price falls below 76.75, because that would break immediate support and weaken the current range structure.
- Ideal Entry Range: 76.75 to 77.49
- Exit Target: 78.47 to 78.54
- Stop Loss protection: below 76.44
In plain English: DBS is not broken, but it has not yet proved it can turn this quiet range into a stronger move.
“The stock is waiting for the next decisive push, and the chart says that push has not arrived yet.”
Summary Data DBS
| Last price | 77.21 SGD |
| Change 1 day / 5 days / 1 month | -0.19% / -1.01% / -1.83% |
| Trend / MA-cross | sideways / none |
| SMA20 / SMA50 | 77.49 / 76.47 |
| RSI (14) / Stochastic %K | 51.5 / 41.1 |
| Bollinger %B / ATR | 37% / 0.90 |
| Support / Resistance 20 days | 76.75 / 78.47 |
| Data as of | 2 Oktober 2026 08:00 WIB |
Track DBS share price daily: live levels, support/resistance and our full DBS analysis history.


