OCBC Stock Analysis: Gains 0.35%, Momentum Weakens
On Oktober 5, 2026: price 31.66 SGD, trend sideways, RSI 53.0, support 31.00, resistance 32.22. technical analysis of ocbc stock. OCBC Stock Analysis — full…

OCBC Bank’s shares on SGX edged up to 31.66 SGD, a modest 0.35% gain from the previous close, but the tape still looks more like a pause than a decisive move. As shown in the chart, the stock is sitting right on its SMA20 at 31.66, which is important because it signals balance: buyers and sellers are meeting at the short-term average rather than driving price away from it. That matters more than the daily gain itself. The shares are still below the SMA20 on the broader reading, while the SMA50 at 31.00 remains beneath price, so the medium-term structure is not broken, just compressed.
Trend & Price Action
The trend is officially sideways, and the slope of the SMA20 at 0.11% over 5 days confirms that this is a low-conviction drift rather than a clean directional run. Price is positioned at about 54% of the 20-hour range, which tells us it is not pressing either extreme; that is consistent with a market waiting for a catalyst. The stock has also slipped 1.09% over 5 days and 1.89% over 1 month, so recent momentum has been soft even though the longer structure still sits above the SMA50. The 3-month high of 32.57 is close enough to matter, because the market is still trading under that ceiling, while the 3-month low of 24.67 shows how far the price has already recovered from deeper weakness. That recovery, however, has not yet turned into a fresh breakout.
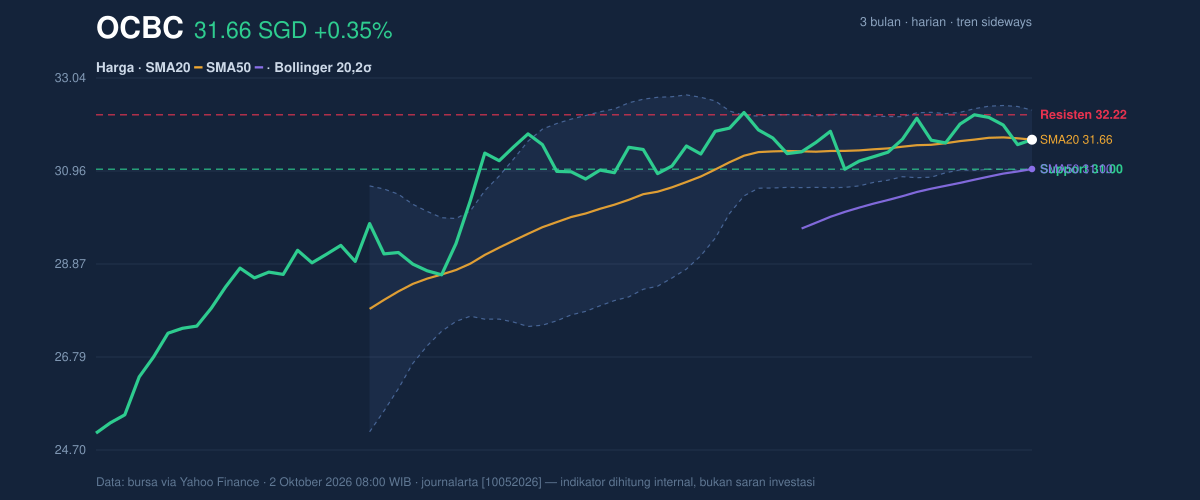
The key signal here is compression. The Bollinger band width of 4.2% is narrow, and the bands are described as a squeeze, which usually means volatility has contracted and a larger move may follow. In plain terms, the stock is coiling. The middle band at 31.66 matches the last price, so the market is hovering at the equilibrium point, while the upper band at 32.32 and lower band at 31.00 frame the next likely test zones. A close above the upper band would suggest expansion to the upside; a slip toward the lower band would imply the squeeze is resolving lower instead.
Oscillators & Momentum
The momentum picture is mixed rather than decisive. The RSI at 53.0 is neutral, which means the stock is neither overbought nor oversold and has room to move either way. The Stochastic %K at 49.6 and %D at 55.0 are also neutral, but the fact that %K sits below %D hints that short-term momentum is still slightly softer than it was. That is not a bearish collapse signal; it is more of a hesitation signal. As shown in the chart, the oscillators are not confirming a strong breakout attempt yet.
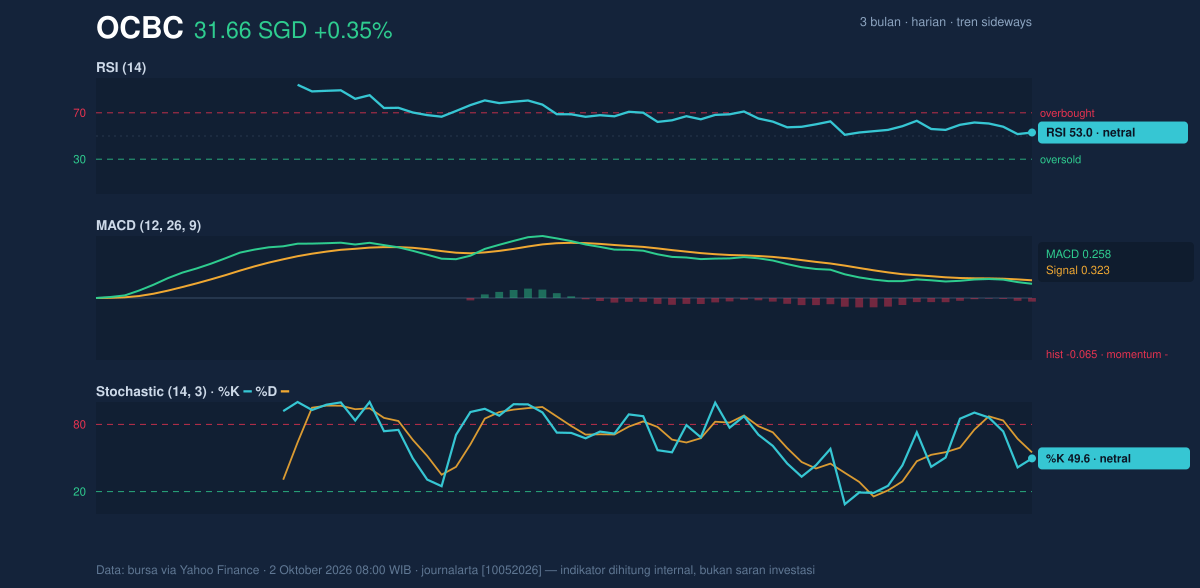
The more cautionary reading comes from MACD at 0.258 versus its signal line at 0.323, leaving a histogram of -0.065. That negative histogram means the trend’s internal momentum has slipped below its recent average, even though price has not broken down. In practical terms, price is still holding up, but the engine underneath is not accelerating. When MACD turns negative while RSI and Stochastic remain neutral, it often points to a market that is consolidating rather than one already in a strong downtrend.
Volatility & Volume
Volume offers a partial confirmation, but not a full one. The latest turnover of 7,121,700 shares is about 1.2× normal versus the 20-day average of 6,085,912, which suggests there is real participation behind the move rather than a thin, noisy print. Still, the OBV is down, and that matters because OBV tracks whether volume is accumulating or distributing over time. A rising price with falling OBV can mean rallies are not being broadly supported. In other words, the market is trading actively, but the flow of ownership has not yet clearly turned constructive.
The ATR at 0.48, or 1.5% of price, says daily volatility is moderate. Combined with the Bollinger squeeze, that points to a stock that is calm now but capable of widening quickly if a catalyst appears. The signal is not explosive yet; it is compressed.
Key Levels & Scenarios
The nearest support is 31.00, which lines up with the lower Bollinger band and the SMA50. That makes it a meaningful floor, not just a random line on the chart. The nearest resistance is 32.22, with the upper Bollinger band at 32.32 and the 3-month high at 32.57 sitting just above that. This creates a tight corridor. If price clears 32.22 and then 32.32, the squeeze would be resolving upward and the chart would start to look less neutral. If price fails to hold 31.00, the compression would likely unwind downward, and the recent sideways structure would lose credibility.
Technical Verdict: HOLD (wait & see)
HOLD (wait & see) fits best because the chart is compressed, but momentum is not aligned strongly enough to justify a directional call.
- MACD histogram at -0.065 shows momentum is still slightly negative.
- RSI at 53.0 and Stochastic %K 49.6 / %D 55.0 are neutral, so there is no strong confirmation either way.
- Bollinger bands are in a 4.2% squeeze, which often precedes a move, but not yet a confirmed one.
Verdict invalidated if price falls below 31.00, because that would break support, the lower Bollinger band, and the SMA50 together.
- Ideal Entry Range: 31.00 to 31.66
- Exit Target (Target Price): 32.22 to 32.57
- Stop Loss protection: below 31.00
For non-traders, this means the stock is sitting at a decision point, and the next move matters more than the current one.
The next chart signal to watch is whether OCBC can close above 32.22 or slip back under 31.00.
Summary Data OCBC
| Last price | 31.66 SGD |
| Change 1 day / 5 days / 1 month | 0.35% / -1.09% / -1.89% |
| Trend / MA-cross | sideways / none |
| SMA20 / SMA50 | 31.66 / 31.00 |
| RSI (14) / Stochastic %K | 53.0 / 49.6 |
| Bollinger %B / ATR | 50% / 0.48 |
| Support / Resistance 20 days | 31.00 / 32.22 |
| Data as of | 2 Oktober 2026 08:00 WIB |
Track OCBC share price daily: live levels, support/resistance and our full OCBC analysis history.


