UOB Stock Drops 0.53% Today, Golden Cross Formed
On Oktober 5, 2026: price 43.11 SGD, trend uptrend, RSI 59.0, support 40.99, resistance 43.34. technical analysis of uob stock. UOB Stock Drops — full details…

United Overseas Bank’s shares on SGX eased to SGD 43.11 on 2 October 2026 at 08:00 WIB, down 0.53% from the previous close of SGD 43.34, but the broader tape still points to a constructive setup as the stock trades above its short- and medium-term moving averages and sits near the top of its recent range. The message from the chart is not that momentum has disappeared; it is that the advance has paused just below a short-term ceiling, with traders now watching whether the share can convert that pause into another leg higher or slip back into the middle of the band.
Trend & Price Action
As shown in the chart, UOB remains in an uptrend, helped by a golden cross where the SMA20 has moved above the SMA50. That crossover matters because it usually signals that shorter-term buying pressure has overtaken the slower trend, a sign that the market is willing to pay up for the stock rather than fade rallies. The SMA20 at SGD 42.20 is also rising, with a slope of 0.88% over five days, which means the trend is not just positive but still gaining traction.
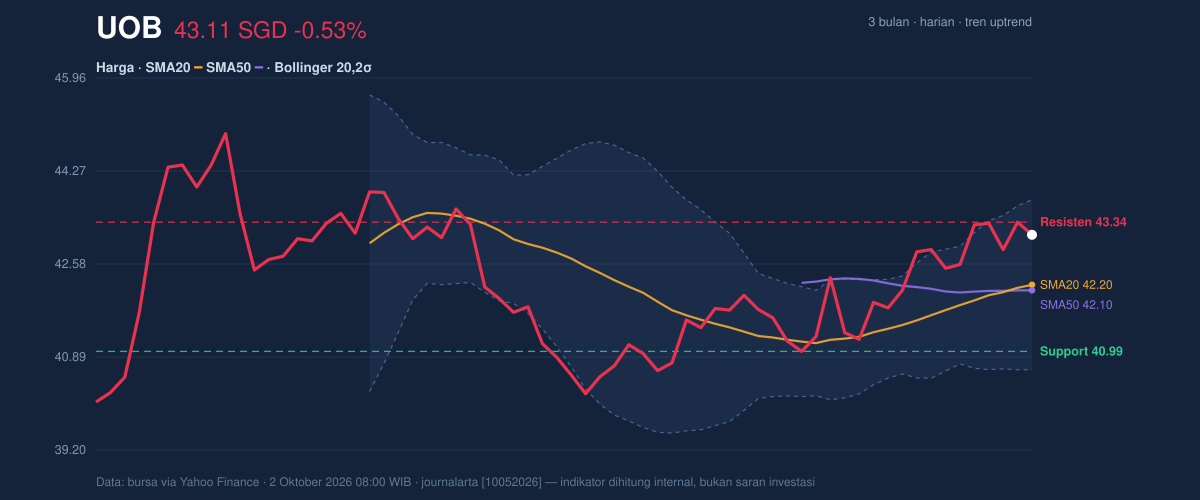
The current price is still above both moving averages, which keeps the structure intact, while the share also trades in the upper part of its 20-day support-resistance range. The immediate reference points are clear: support at SGD 40.99 and resistance at SGD 43.34. Price sitting at roughly 90% of the range suggests buyers have already done much of the heavy lifting, but also that the stock is approaching an area where supply has recently appeared. In plain terms, the market is close to a decision point: either it clears the local cap and extends, or it cools off and tests whether demand is deep enough to defend the lower band.
The Bollinger framework reinforces that tension. The band middle at SGD 42.20 aligns with the SMA20, while the upper band at SGD 43.75 leaves only limited room before the stock enters a zone where rallies have less breathing space. The 7.3% band width is relatively tight and described as a squeeze, which often precedes a larger move. A squeeze does not predict direction on its own, but it does mean the stock has been compressing energy; once price leaves the band, the move can be sharper than the recent daily drift.
Oscillators & Momentum
The momentum signals are constructive, but not yet stretched enough to imply an exhausted rally. The RSI at 59.0 is neutral, which tells readers the stock is neither overbought nor oversold. That is important because an RSI near 60 often indicates positive momentum without the kind of overheated reading that typically invites heavy profit-taking. The Stochastic oscillator at 75.1 / 75.7 is also neutral, though it sits near the upper end of its scale, meaning the share is trading with some upward pressure but not in a deeply overextended state.
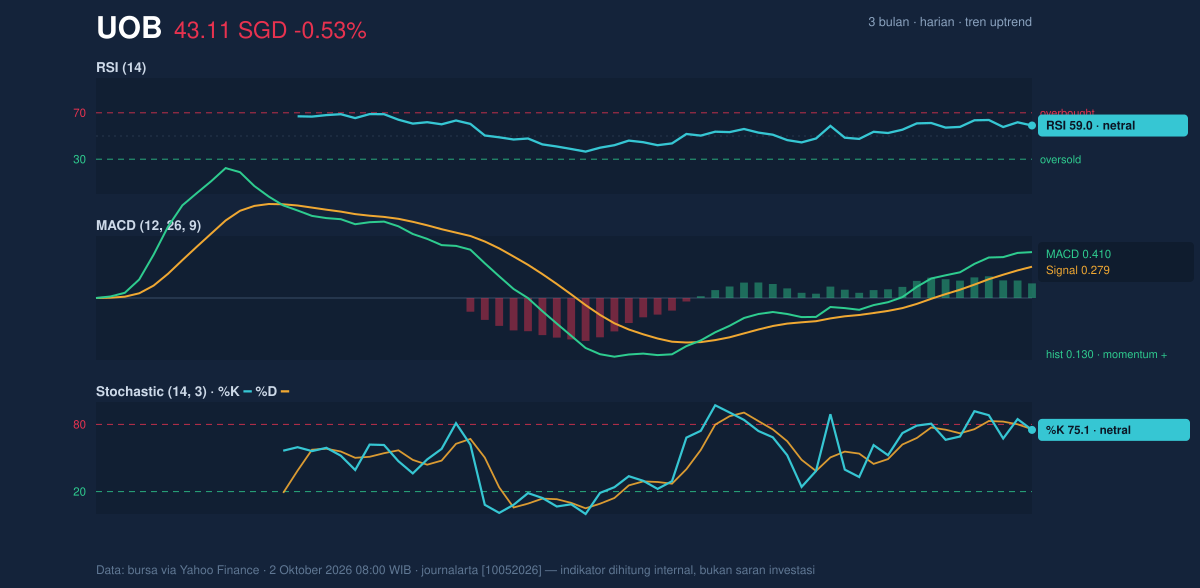
The MACD at 0.410, above its signal line at 0.279, with a histogram of 0.130, is the cleanest sign that the momentum engine is still positive. For general readers, MACD compares faster and slower trend measures; when the faster line stays above the signal line, it usually means the trend remains supported. The positive histogram shows that the gap between those lines is still working in the stock’s favor, even if the latest daily price change was slightly negative. That combination — neutral RSI, near-top Stochastic, and positive MACD — suggests the stock is trending up without showing a clear reversal warning.
Volatility & Volume
Volatility is moderate rather than explosive. The ATR at 0.81, equal to 1.9% of price, implies the stock typically moves enough each day to matter, but not so violently that the chart is unstable. That matters because a stock with moderate ATR can still break out, but the move may need a catalyst or a clear technical trigger rather than sheer momentum alone.
Volume also supports the current trend, though not dramatically. Last volume came in at 3,356,529, slightly below the 20-day average of 3,530,315, or about 1.0x normal. On its own, that says the latest session was not a high-conviction surge, but the OBV is rising, which is more important than a single-day volume print because it indicates that, over time, more volume has been associated with upward price movement than with declines. In other words, participation has been quietly backing the trend even if the latest session was not a volume breakout.
Key Levels & Scenarios
The near-term map is straightforward. A move above SGD 43.34 would place the stock back above immediate resistance and open the way toward the upper Bollinger band at SGD 43.75. That would be the first sign that the squeeze is resolving upward. If momentum carries beyond that zone, the chart would be signaling that buyers are willing to pay above the recent range rather than merely defend it.
On the downside, SGD 42.20 is the first structural line to watch because it matches the SMA20 and the Bollinger middle band. A fall through that area would not break the broader uptrend immediately, but it would tell the market that the short-term pace has weakened and that price may revert toward the lower half of the band. The deeper line in the sand is SGD 40.99; losing that support would damage the current setup and suggest the recent advance has failed to hold. The 3-month range, from SGD 39.56 to SGD 45.15, shows there is still room above the market before it revisits the upper end of the broader band, but the path there depends on whether resistance near today’s close can be cleared.
Technical Verdict: HOLD (wait & see)
HOLD (wait & see)
- MACD remains positive, so trend momentum is still supportive.
- Golden cross and price above SMA20/SMA50 keep the broader structure constructive.
- Bollinger squeeze suggests a larger move may be forming, but direction is not yet confirmed by volume.
Verdict invalidated if price falls below SGD 40.99.
- Ideal Entry Range: SGD 42.20 to SGD 43.34
- Exit Target: SGD 43.75
- Stop Loss protection: below SGD 40.99
In plain English, the chart says UOB is still healthy, but the next move needs confirmation before the market shows its hand.
Summary Data UOB
| Last price | 43.11 SGD |
| Change 1 day / 5 days / 1 month | -0.53% / 1.27% / 2.62% |
| Trend / MA-cross | uptrend / golden |
| SMA20 / SMA50 | 42.20 / 42.10 |
| RSI (14) / Stochastic %K | 59.0 / 75.1 |
| Bollinger %B / ATR | 79% / 0.81 |
| Support / Resistance 20 days | 40.99 / 43.34 |
| Data as of | 2 Oktober 2026 08:00 WIB |
Track UOB share price daily: live levels, support/resistance and our full UOB analysis history.


