Death Cross Pressure, Singtel Stock Drops 0.47% Today
On Oktober 5, 2026: price 4.25 SGD, trend downtrend, RSI 34.0, support 4.25, resistance 4.56. technical analysis of singtel stock. Death Cross Pressure — full…

Singapore Telecom (Singtel) on SGX slipped to SGD 4.25 on 2 October 2026, down from 4.27, as the shares stayed pinned at the bottom of their short-term range and extended a one-month decline of 5.97%. The move matters because it is not just a one-day wobble: the stock is trading below both its SMA20 at 4.38 and SMA50 at 4.41, while the chart has already printed a death cross, a signal that the shorter average has crossed below the longer one and often reflects weakening medium-term price structure.
Trend & Price Action
The chart shows a market that is still losing altitude rather than stabilising, with the downtrend reinforced by the SMA20 slope of -1.22% over five days. That slope is useful because it tells investors the average price itself is falling, not merely that the last trade was weak. When price sits below both moving averages, rallies tend to face selling pressure as traders who bought higher use rebounds to exit.
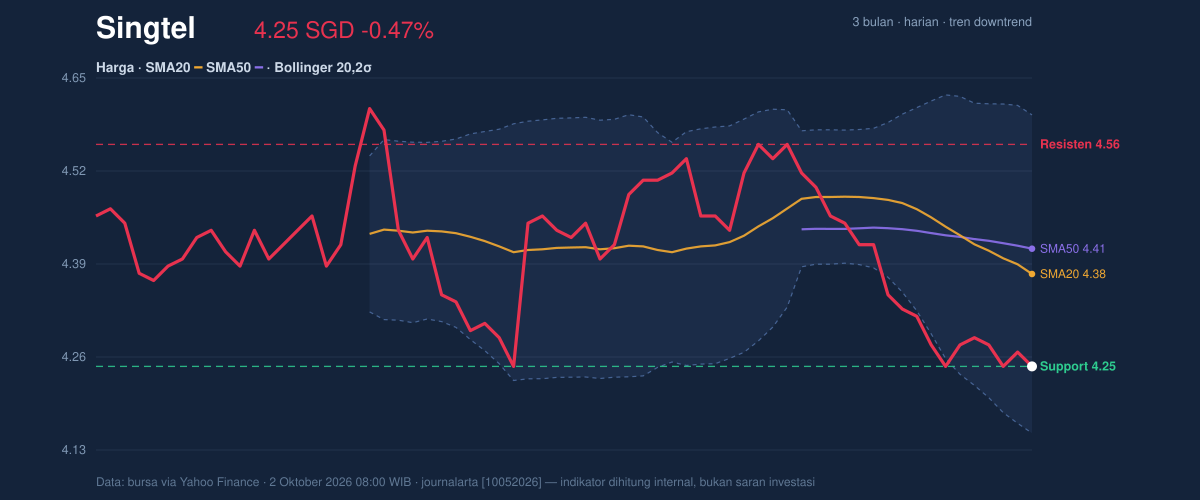
Singtel is also sitting at the very bottom of its 20-hour range, with support at 4.25 and resistance at 4.56. That positioning is important: the market is not merely below resistance, it is already pressing on support. The 3-month low of 4.19 is close enough to matter, because a break beneath the current floor would put the stock back into a zone where recent buyers have had little protection.
The Bollinger Bands help frame that setup. Price is near the lower band at 4.16, while the middle band is 4.38 and the upper band 4.60. With %B at 21%, the share price is trading in the lower fifth of the band structure, which usually signals weakness rather than strength. The band width of 10.1% is described as normal, so this is not a volatility squeeze waiting to explode; instead, the market appears to be drifting lower in an orderly, low-drama decline.
Oscillators & Momentum
Momentum is mixed on the surface but still tilted negative underneath. RSI at 34.0 is close to oversold territory, which means the stock is weak but not yet at an extreme where a bounce becomes mechanically likely. In plain language, the selling has been persistent enough to drain momentum, but not so stretched that the chart is flashing a clear reversal signal.
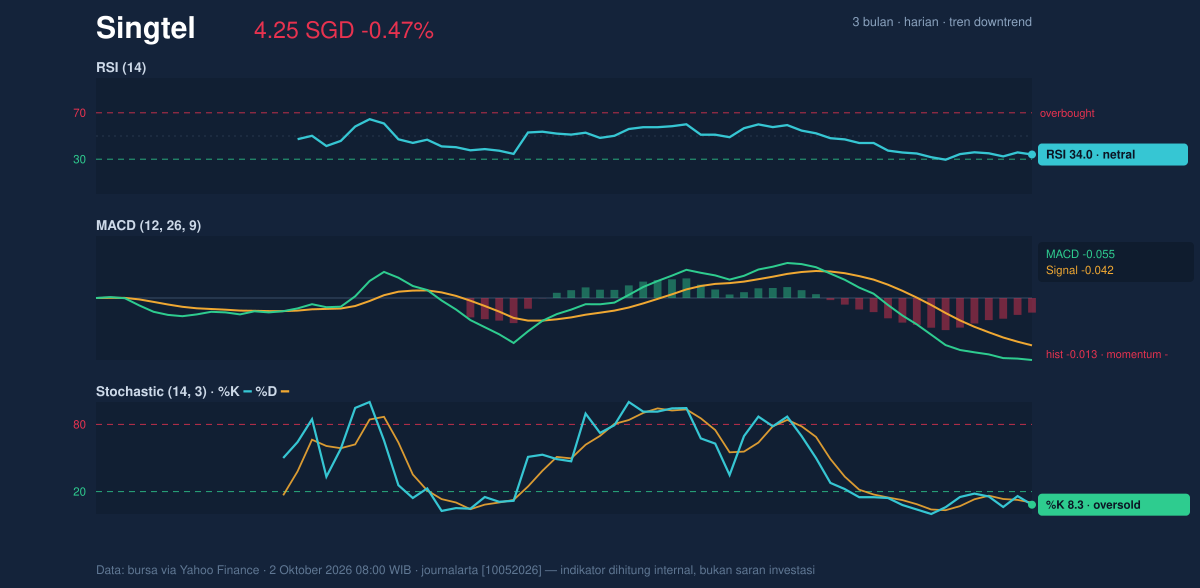
The stochastic oscillator is more telling. %K at 8.3 and %D at 10.2 both sit in oversold territory, showing the stock has been closing near the lower end of its recent range. That often happens when sellers remain in control and buyers are unwilling to chase. It can precede a rebound, but only if price starts to reclaim nearby resistance; otherwise it simply confirms that the stock is weak.
The MACD at -0.055, below its signal line at -0.042, with a negative histogram of -0.013, confirms that downside momentum is still active. MACD is a trend-following gauge, so when it remains below the signal line, it usually means the latest price action is still worse than the recent average. In this case, the oscillator stack is not yet aligned with a recovery.
Volatility & Volume
Volatility is subdued, which often means the market is waiting for a trigger rather than building pressure for a sharp immediate move. The ATR of 0.06, equal to 1.4% of price, points to relatively low daily movement. That matters because low ATR in a downtrend can mean sellers are in no hurry, and any recovery attempt may need volume to prove it is real.
Volume does not yet provide that proof. Last trade volume of 18,231,900 was only 0.9x the 20-hour average of 20,429,555, so the latest dip did not come with a strong participation surge. That weak volume profile makes the decline look methodical rather than panicked, but it also means there is no convincing evidence of aggressive dip-buying. The OBV is falling, which is a further warning sign because on-balance volume tracks whether money flow is accumulating or leaving the stock; a decline suggests distribution rather than accumulation.
Key Levels & Scenarios
The immediate support at 4.25 is the key line in the sand, and the next reference below it is the 3-month low at 4.19. If the stock fails to hold 4.25, the chart would likely test that lower boundary quickly. On the upside, 4.38 is the first meaningful hurdle because it is both the Bollinger middle band and close to the SMA20, while 4.41 is the SMA50 and 4.56 is the near-term resistance zone.
The signal hierarchy is straightforward: price is weak below the moving averages, momentum is oversold but not reversing, and volume is not confirming a turnaround. That combination usually favours caution until the chart can reclaim the mid-band area around 4.38 and prove that sellers are losing control.
Technical Verdict: HOLD (wait & see)
- Reason 1: Price is below SMA20 at 4.38 and SMA50 at 4.41, with a death cross already in place, which keeps the medium-term trend negative.
- Reason 2: RSI at 34.0 and Stochastic at 8.3 / 10.2 show the stock is oversold, but MACD at -0.055 remains below signal, so momentum has not turned up.
- Reason 3: OBV is down and volume is only 0.9x normal, which weakens the case for a durable rebound.
- Verdict invalidated if price breaks below 4.19, the 3-month low.
- Ideal entry range: 4.25 to 4.38, only if price starts to hold above support and reclaim the Bollinger middle band.
- Exit target: 4.56, the nearest resistance level.
- Stop loss protection: below 4.19, to guard against a deeper breakdown.
In plain English, the chart says Singtel is weak, oversold, and waiting for proof that buyers have returned.
Summary Data Singtel
| Last price | 4.25 SGD |
| Change 1 day / 5 days / 1 month | -0.47% / -0.70% / -5.97% |
| Trend / MA-cross | downtrend / death |
| SMA20 / SMA50 | 4.38 / 4.41 |
| RSI (14) / Stochastic %K | 34.0 / 8.3 |
| Bollinger %B / ATR | 21% / 0.06 |
| Support / Resistance 20 days | 4.25 / 4.56 |
| Data as of | 2 Oktober 2026 08:00 WIB |
Track Singtel share price daily: live levels, support/resistance and our full Singtel analysis history.


