Alibaba Stock Analysis: Drops 4.36%, Momentum Gains
On September 24, 2026: price 109.80 HKD, trend sideways, RSI 47.2, support 105.10, resistance 115.50. technical analysis of alibaba stock.

Alibaba Group’s Hong Kong-listed shares fell to HKD 109.80 on Tuesday, slipping 4.36% from the previous close, even as the stock held just above its SMA20 at HKD 109.79, according to data from HKEX via Yahoo Finance. The move leaves the chart in a cautious middle ground: not weak enough to confirm a breakdown, but not strong enough to reclaim the broader trend, with the shares still trading below the SMA50 at HKD 115.47 and inside a sideways pattern.
Trend & Price Action
The most important signal in the price structure is that Alibaba is sitting almost exactly on its short-term trend line. That matters because the price above the SMA20 suggests the immediate selling pressure has not yet fully taken control, but the fact that the SMA20 is still below the SMA50 points to a market that remains softer over the medium term. In plain language, the stock is trying to stabilize, but it has not repaired the damage done by the weaker 1-month performance of -5.83%.
The broader setup is still range-bound. The 20-hour support at HKD 105.10 and resistance at HKD 115.50 frame the current battle, and the latest price sits at roughly the lower-middle portion of that band. The stock is also well below its 3-month high of HKD 130.30 and above the 3-month low of HKD 88.65, which shows a market that has recovered from deep weakness but has not yet regained clear upward leadership.
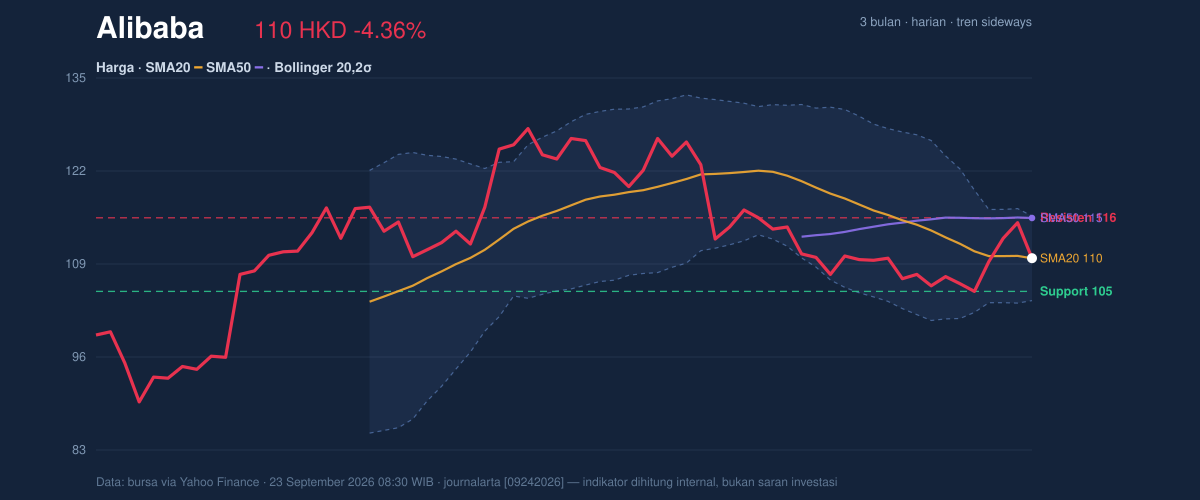
A short-term bounce is possible. A trend change is not yet confirmed.
Oscillators & Momentum
The momentum picture is mixed, which is often what a sideways market looks like before it chooses a direction. The RSI at 47.2 is neutral, meaning the stock is neither stretched on the upside nor washed out on the downside. That usually signals indecision rather than conviction. The Stochastic %K at 39.7 versus %D at 71.2 is also neutral, but the gap shows near-term momentum has cooled from a stronger reading, suggesting the recent pullback has taken some heat out of the advance.
The one constructive element is the MACD setup. Alibaba’s MACD at -1.424 remains below zero, so the broader momentum backdrop is still not fully bullish. But the signal line at -2.019 is lower, leaving a positive histogram of 0.594. That combination usually means downside momentum is fading and the stock is attempting a recovery from a weaker phase. In other words, the MACD is not saying “strong uptrend,” but it is saying “selling pressure is easing.”
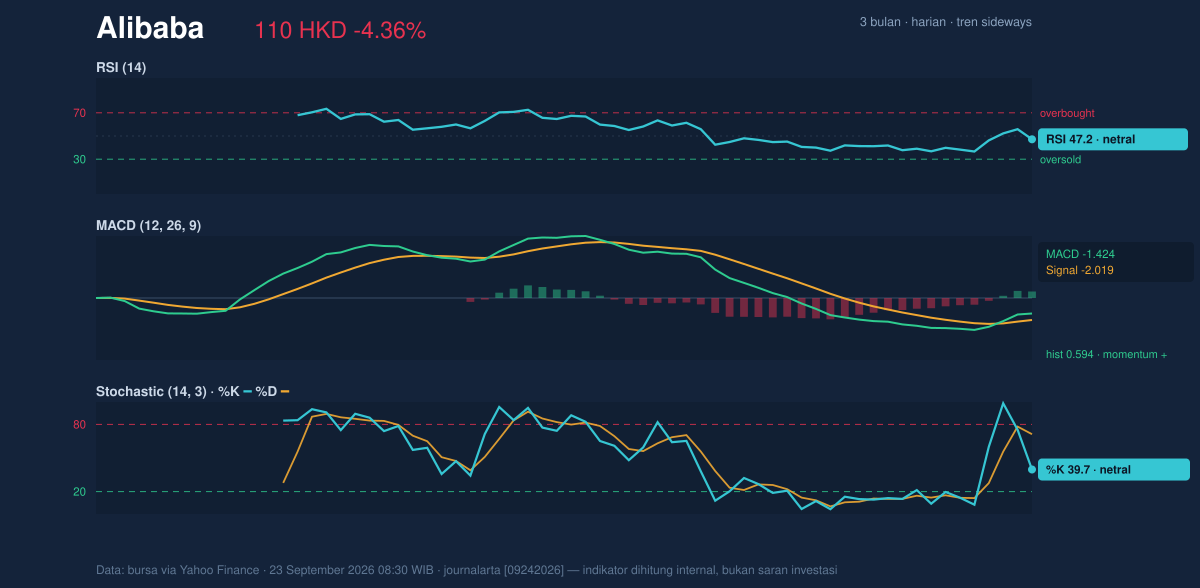
That is the difference between stabilizing and surging.
Volatility & Volume
Volatility is present, but not extreme. The ATR(14) of 3.51, equal to 3.2% of price, indicates a market that can still move decisively in either direction without needing a major catalyst. The Bollinger Bands reinforce that reading. With the middle band at HKD 109.79, the shares are effectively sitting on the band’s center line, while the upper band at HKD 115.76 and lower band at HKD 103.81 define the likely near-term envelope. The %B at 50% is a classic sign of equilibrium: price is neither pressing the top of the range nor breaking down toward the lower edge.
The band width of 10.9% is described as normal, which means there is no squeeze building up a major breakout yet. That matters because low-volatility squeezes often precede sharp moves; here, the market looks more settled, implying any breakout may need volume or a catalyst to stick.
Volume, however, adds a small constructive clue. The latest turnover of 86,835,983 shares is about 1.3× the 20-hour average of 68,896,474, and OBV is rising. Rising on-balance volume means more shares are changing hands on the upswings than the downswings, which can hint at accumulation even while the price is still trapped in a range. That is not a guarantee of upside, but it is a sign that buyers have not disappeared.
Key Levels & Scenarios
The chart suggests a simple map. If Alibaba can hold above the HKD 109.79-109.80 area and push through HKD 115.50-115.76, the next test would be whether momentum can improve enough to turn the current recovery into something more durable. If it fails to hold the HKD 105.10 support, the risk shifts back toward the lower Bollinger Band at HKD 103.81, where traders would likely reassess whether the sideways pattern is breaking down rather than resolving higher.
The core signal is still balance, not trend. Price is close to support, momentum is improving but not yet strong, and volume is supportive without being decisive.
Technical Verdict: HOLD (wait & see)
HOLD (wait & see)
- RSI 47.2 is neutral, so there is no strong momentum confirmation either way.
- MACD histogram 0.594 is positive, but MACD -1.424 remains below zero, showing recovery rather than a full trend reversal.
- Price is pinned near the SMA20 at HKD 109.79 and below the SMA50 at HKD 115.47, so the medium-term trend is still not repaired.
Verdict invalidated if price breaks below HKD 105.10.
- Ideal Entry Range: HKD 105.10 to HKD 109.80
- Exit Target (Target Price): HKD 115.50 to HKD 115.76
- Stop Loss protection: Below HKD 103.81
For non-traders: the stock is stabilizing, but it has not yet proved that the recent weakness is over.
Alibaba traded at HKD 109.80 in Hong Kong, with volume at 86,835,983 shares.
Summary Data Alibaba
| Last price | 109.80 HKD |
| Change 1 day / 5 days / 1 month | -4.36% / 3.39% / -5.83% |
| Trend / MA-cross | sideways / none |
| SMA20 / SMA50 | 109.79 / 115.47 |
| RSI (14) / Stochastic %K | 47.2 / 39.7 |
| Bollinger %B / ATR | 50% / 3.51 |
| Support / Resistance 20 days | 105.10 / 115.50 |
| Data as of | 23 September 2026 08:30 WIB |


