Alibaba Stock Analysis: Drops 1.04%, Death Cross Pressure
On September 18, 2026: price 105.10 HKD, trend downtrend, RSI 36.1, support 105.10, resistance 123.00. technical analysis of alibaba stock.

Alibaba Group’s Hong Kong-listed shares fell to HKD 105.10 on the HKEX, below the 20-day average and deep inside a short-term downtrend, with the chart showing a death cross as the 20-day moving average slipped under the 50-day line. That matters because a death cross is not just a pattern label: it tells traders the recent pace of selling has been strong enough to overwhelm the longer trend, while the stock’s position near the lower edge of its Bollinger Band suggests the market is still pricing in caution rather than recovery.
Trend & Price Action
The price action is weak by several measures at once. Alibaba is trading below SMA20 at HKD 110.77 and below SMA50 at HKD 115.44, which means the stock is not only under short-term trend support but also under the medium-term average that often acts as a reference point for institutional positioning. The downtrend is reinforced by the SMA20 slope of -3.79% over 5 days, a sign that the recent decline is still accelerating rather than flattening out.
The broader range also shows room below current levels before a major historical floor comes into view. The stock’s 3-month high of HKD 130.30 and 3-month low of HKD 88.65 frame a wide trading band, but the current price is sitting much closer to the lower half of that range than the upper half. In practical terms, the market has not yet shown a clean base-building pattern.
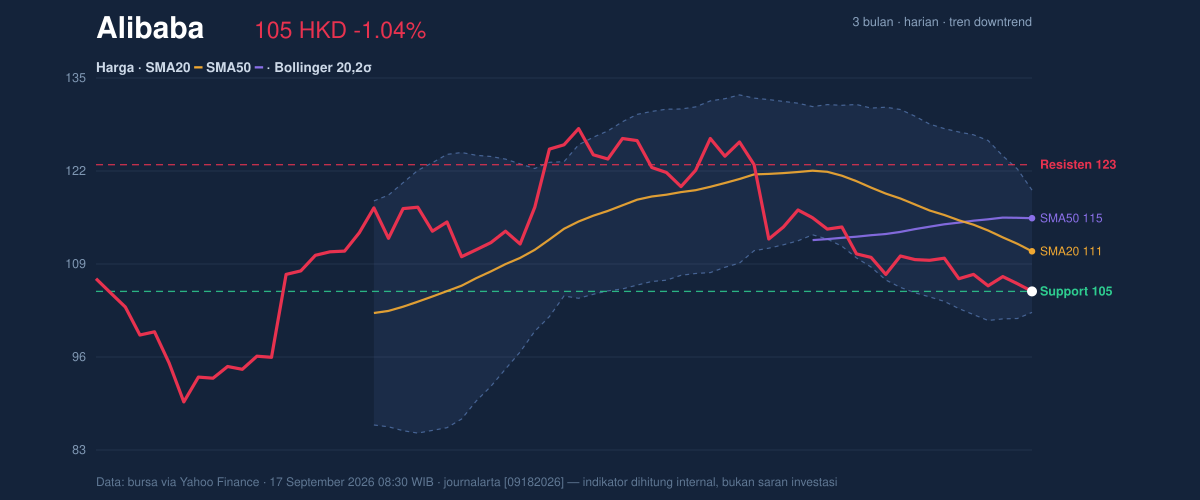
The immediate support at HKD 105.10 is especially important because the last print is sitting right on that level. If a support level is being tested repeatedly while volume stays weak, it usually signals that buyers are present but not yet forceful enough to reverse the trend.
Oscillators & Momentum
Momentum indicators are mixed, but the overall message is still negative. The RSI(14) at 36.1 is technically neutral, which means the stock is not yet in a classic oversold rebound zone, even though it is close enough to suggest selling pressure may be getting stretched. By contrast, the Stochastic %K at 8.3 and %D at 14.2 show an oversold condition, meaning the stock has moved down quickly enough that short-term traders may start watching for a bounce.
That said, the bigger momentum signal is still the MACD. The MACD at -2.992, below the signal line at -2.409, with a negative histogram of -0.583, shows downside momentum is still active. In plain language, the stock is falling faster than the trend-following indicator can catch up, which usually means any rebound attempt needs confirmation rather than assumption.
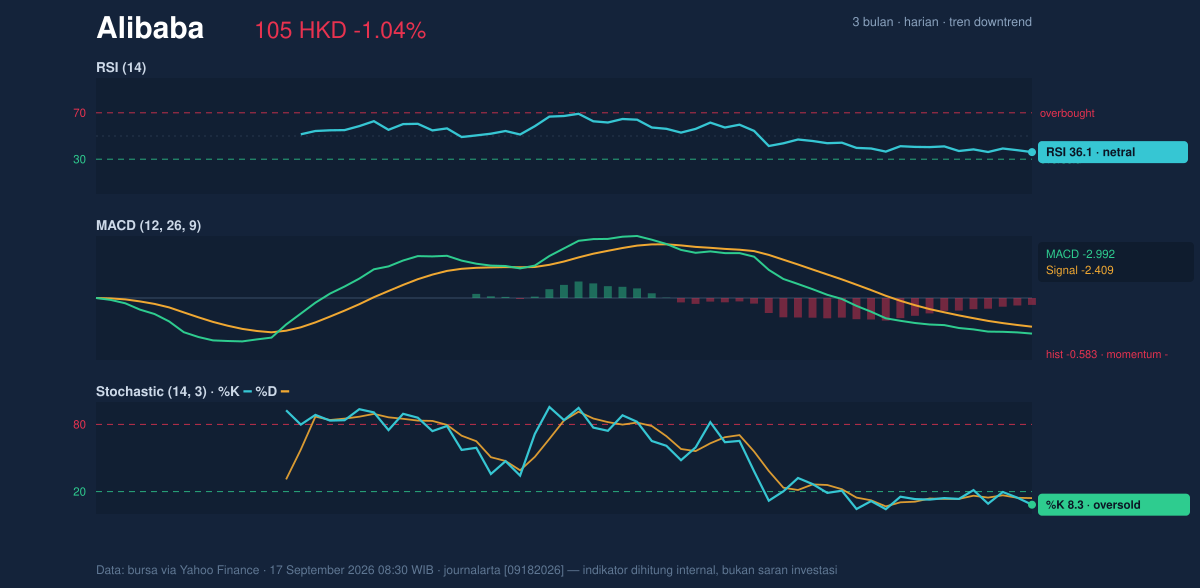
So while the oscillator setup hints at exhaustion, the trend-following momentum tool still says the move lower has not fully run its course.
Volatility & Volume
Bollinger Bands help show where price sits relative to its recent trading envelope. Alibaba’s %B at 17% places the stock near the lower band, and the band width of 15.6% is described as normal rather than squeezed. That combination matters: the stock is not in a quiet compression phase that often precedes a breakout, but it is also not showing extreme panic volatility. The chart therefore implies a market that is drifting lower with controlled pressure, not one that is suddenly capitulating.
ATR(14) at 3.11, equal to about 3.0% of price, points to moderate day-to-day movement. That means the stock can still travel meaningfully in either direction, but not in a disorderly way. Volume tells a similar story of hesitation: the latest turnover of 50,647,519 is only about 0.6× the 20-day average of 89,516,709, and OBV is falling. OBV, or on-balance volume, tracks whether volume is flowing into up days or down days; a falling line means sellers have had the stronger hand in the background.
Quiet volume on a weak chart is not a bullish signal.
Key Levels & Scenarios
The nearest reference levels are clear. The stock’s support at HKD 105.10 is being tested now, while the next obvious overhead barrier is HKD 123.00, the listed 20-hour resistance. Between those points, the market has to prove it can reclaim the SMA20 at HKD 110.77 first, then challenge the SMA50 at HKD 115.44. The Bollinger midline at HKD 110.77 aligns with SMA20, so that level is more than a chart line: it is the first sign that the stock is escaping the latest selling phase.
If price holds HKD 105.10 and momentum stabilizes, the oversold stochastic reading raises the chance of a reflex bounce toward HKD 110.77. If it fails to hold that level, the chart leaves little nearby support until the broader range opens up again. The key point is that the current setup is reactive, not constructive.
Technical Verdict: HOLD (wait & see)
HOLD (wait & see) is the clearest technical reading because the chart is still in a death cross, price remains below SMA20 and SMA50, and MACD is negative, even though Stochastic is oversold and price is pressing the lower Bollinger area.
- Reason 1: Death cross and downtrend confirm the broader technical bias is still negative.
- Reason 2: MACD -2.992 below signal and OBV falling show sellers still control momentum and participation.
- Reason 3: Stochastic oversold and %B 17% hint at a possible rebound, but not yet one confirmed by volume or trend recovery.
- Verdict invalidated if price breaks above HKD 110.77, which would mean the stock has reclaimed the 20-day average and the Bollinger midline.
- Ideal entry range: HKD 105.10 to HKD 110.77, only if price stabilizes and momentum stops deteriorating.
- Exit target: HKD 115.44 to HKD 123.00, using the SMA50 and resistance as the next technical checkpoints.
- Stop loss protection: below HKD 102.13, the lower Bollinger Band, where the current setup would lose its near-term support structure.
In plain English: the stock is weak, but the chart is close enough to support that traders may wait for proof of stabilization rather than chase the decline.
Latest listed support: HKD 105.10.
Summary Data Alibaba
| Last price | 105.10 HKD |
| Change 1 day / 5 days / 1 month | -1.04% / -1.68% / -16.72% |
| Trend / MA-cross | downtrend / death |
| SMA20 / SMA50 | 110.77 / 115.44 |
| RSI (14) / Stochastic %K | 36.1 / 8.3 |
| Bollinger %B / ATR | 17% / 3.11 |
| Support / Resistance 20 days | 105.10 / 123.00 |
| Data as of | 17 September 2026 08:30 WIB |


