Singtel Stock Technicals Today: Drops 0.67%, Testing Support Level
On September 18, 2026: price 4.42 SGD, trend sideways, RSI 44.4, support 4.40, resistance 4.56. technical analysis of singtel stock. Singtel Stock Technicals —…

Singapore Telecommunications Ltd. slipped to SGD 4.42 on SGX on 16 September 2026, down from the previous close of 4.45, as the stock stayed pinned near the lower end of its recent trading band. The move matters because it is not a sharp breakdown, but it does show that buyers have yet to reclaim control after a weak five-day stretch, with the price still sitting below SMA20 at 4.49 and only marginally above SMA50 at 4.44.
Trend & Price Action
The broader setup is still best described as sideways, but the short-term tone has softened. That matters because sideways markets often hide a battle between trend-followers and mean-reversion traders, and here the evidence leans toward hesitation rather than conviction. The stock’s last price of 4.42 is below the 20-day average, which usually signals that recent buying pressure has faded, while the lack of a fresh moving-average cross suggests there is no new trend signal to anchor a stronger directional view.
The chart also shows price trading near the bottom of its current range, with support at 4.40 and resistance at 4.56. That positioning is important because a stock near range support can either stabilize and rebound, or lose that floor and invite another leg lower. The broader three-month range of 4.19 to 4.70 gives context: Singtel is not near a panic low, but it is closer to the lower half of the range than the upper half, which suggests caution is still warranted.
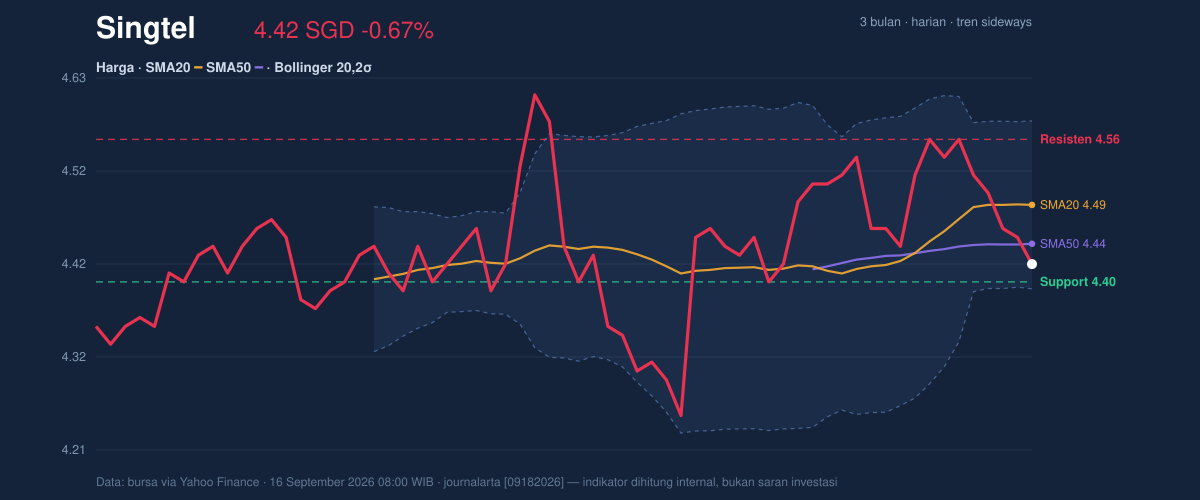
The Bollinger Band structure adds another layer. With the middle band at 4.49, the upper band at 4.58, and the lower band at 4.39, price is leaning toward the lower band while the band width has narrowed to 4.2%. A squeeze like this often means the market is coiling rather than trending freely, so the next move can be sharper than the recent day-to-day drift. In plain terms, the stock is compressing, and compression often precedes expansion.
Oscillators & Momentum
The momentum signals are mixed, which is usually what traders see when a stock is trying to find a floor but has not yet proven it can turn higher. The RSI at 44.4 sits in neutral territory, so it is not flashing a strong oversold rebound signal yet. That matters because RSI below 50 often points to weaker momentum, but without a deeper drop it does not confirm a breakdown either.
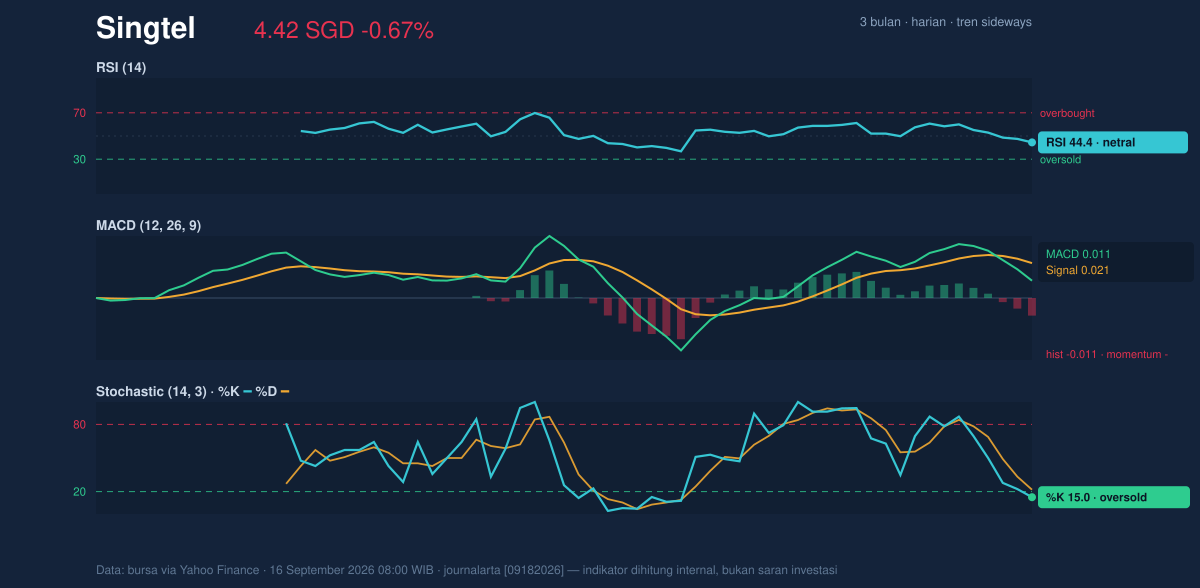
The more interesting clue comes from Stochastic, where %K at 15.0 and %D at 21.7 indicate an oversold reading. Stochastic is more sensitive than RSI, so this can flag short-term exhaustion before the broader momentum tools do. In practical terms, it says sellers may be stretched in the very near term, but not necessarily that a durable rebound has started.
MACD is still leaning negative. With MACD at 0.011, the signal line at 0.021, and a histogram of -0.011, the short-term trend impulse remains below its trigger line. That negative histogram is the key signal here: it means downside momentum is still slightly stronger than upside momentum, even if the gap is not dramatic. Put together, the oscillators point to a stock that is oversold in pockets, but not yet technically reversed.
Volatility & Volume
Volatility is moderate, not elevated. The ATR of 0.07, equal to 1.7% of price, suggests daily swings are contained, which can make support and resistance levels more reliable in the short run. At the same time, the Bollinger squeeze implies that a larger move may be building underneath the surface. That combination often produces a quiet tape before a more decisive break.
Volume did not confirm strength on the latest session. Turnover of 14,805,500 was only 0.8× the 20-session average of 19,104,083, and OBV is falling. OBV, or on-balance volume, tracks whether volume is flowing into or out of a stock; a decline there means recent trading has not been enough to show accumulation. In simple terms, the market is not yet voting with size on the upside.
Key Levels & Scenarios
The immediate technical map is straightforward. 4.40 is the first line to watch on the downside, while 4.56 is the nearest ceiling on the upside. A clean push above 4.56 would matter because it would put price back above the recent range cap and close in on the upper Bollinger band at 4.58. If that fails and 4.40 gives way, the chart would expose the lower band at 4.39 and then the broader three-month low at 4.19.
The fact that price is sitting only a little above support while momentum remains mixed makes this a waiting pattern, not a clean trend setup. The squeeze in Bollinger Bands says the next move could be larger than the recent drift, but volume and OBV have not yet confirmed which direction that move should favor.
Technical Verdict: HOLD (wait & see)
HOLD (wait & see) because:
- Price is below SMA20 at 4.49, showing the short-term trend is still soft.
- MACD histogram is negative at -0.011, so downside momentum has not fully cleared.
- Stochastic is oversold at %K 15.0 and %D 21.7, which hints at exhaustion but not confirmation.
Verdict invalidated if price breaks below 4.40, because that would weaken the nearest support and increase the risk of a slide toward 4.39 and then 4.19.
- Ideal Entry Range: 4.40 to 4.44
- Exit Target: 4.56 to 4.58
- Stop Loss protection: below 4.39
For non-traders, this means the stock is sitting at a technical crossroads, where the next move is more likely to be decided by whether support at 4.40 holds or gives way.
Summary Data Singtel
| Last price | 4.42 SGD |
| Change 1 day / 5 days / 1 month | -0.67% / -3.07% / -0.23% |
| Trend / MA-cross | sideways / none |
| SMA20 / SMA50 | 4.49 / 4.44 |
| RSI (14) / Stochastic %K | 44.4 / 15.0 |
| Bollinger %B / ATR | 15% / 0.07 |
| Support / Resistance 20 days | 4.40 / 4.56 |
| Data as of | 16 September 2026 08:00 WIB |

