DBS Stock Gains 0.25%, Momentum Weakens In Focus
On September 18, 2026: price 76.94 SGD, trend sideways, RSI 52.8, support 75.56, resistance 78.65. technical analysis of dbs stock. DBS Stock Gains — full…

DBS Group’s shares were last quoted at SGD 76.94 on 16 September 2026 at 08:00 WIB, edging up 0.25% from the previous close, but the bigger signal is that the stock is still trading below its SMA20 at 76.97 while remaining well above its SMA50 at 75.08. That combination points to a market that has not broken down, yet has not regained near-term control either: the medium-term floor is intact, but short-term buyers have not fully reasserted themselves. As shown in the chart, DBS is sitting in a sideways structure, with price near the middle of its recent range rather than pressing a trend decisively in either direction.
Trend & Price Action
On a technical basis, the stock is in a sideways trend, and the SMA20 slope of 0.28% over 5 days suggests only a mild upward tilt rather than a clean advance. The absence of a fresh MA-cross matters because it means the chart has not produced a new trend signal from moving averages; instead, the market is still digesting recent moves. Price is also below the SMA20 but comfortably above the SMA50, which often signals a pause inside a broader range rather than a structural reversal. In plain language: the stock is not weak enough to look broken, but not strong enough to look ready for a sustained breakout.
The 3-month range sharpens that picture. DBS has traded between 63.50 and 79.05, and the current level sits much closer to the upper end than the lower end. That is constructive, but not decisive. The stock is also positioned at about 45% of its recent support-resistance range, which is another way of saying it is neither testing support nor challenging resistance. The market is waiting.
Oscillators & Momentum
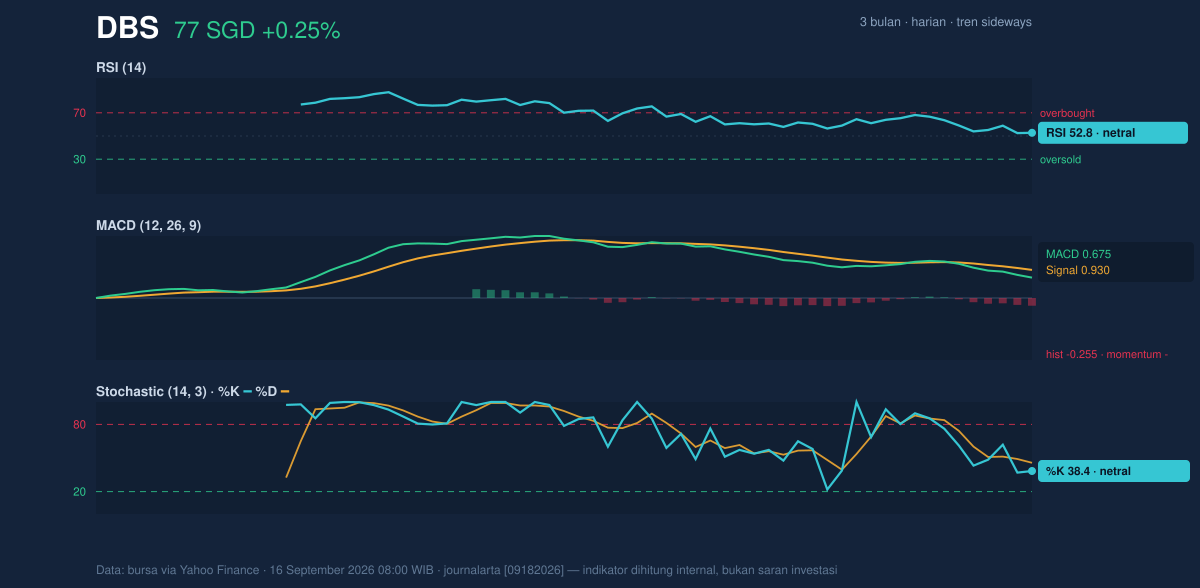
The momentum tools are mixed, and that is the key message from the chart. RSI at 52.8 is neutral, which means the stock is not overbought and not oversold; it is simply balanced. Stochastic %K at 38.4 and %D at 45.8 also sit in neutral territory, but with %K below %D, short-term momentum is softer than the broader neutral reading suggests. The most important warning sign comes from MACD at 0.675 versus signal at 0.930, leaving a -0.255 histogram. That negative histogram means recent price momentum is lagging behind its own trend baseline, even though price has not yet rolled over sharply.
In practical terms, the oscillators are not confirming a breakout. They are telling investors that DBS is holding up, but the push needed to extend the move has not arrived. This is the sort of setup where a stock can drift for a while before a stronger move emerges.
Volatility & Volume
Volatility is subdued. The ATR(14) of 0.92, equal to 1.2% of the share price, indicates relatively narrow daily movement. That matters because low ATR often accompanies consolidation: the market is not pricing in a large immediate swing, even though the Bollinger Bands are tightening. As shown in the chart, the Bollinger Band width of 4.7% is a squeeze, which usually means compression before expansion. The stock’s %B at 49% places it almost exactly in the middle of the bands, reinforcing the idea that DBS is balanced rather than stretched.
Volume does not yet validate a stronger move. Last trading volume was 2,832,200, below the 20-day average of 3,455,455, or about 0.8× normal. When a stock tries to leave a range on lighter participation, the move is easier to fade. The OBV is falling, which is especially important because OBV tracks whether volume is accumulating or leaking away over time. A falling OBV says participation has been weaker than price alone might suggest.
Quiet tape, softer participation.
Key Levels & Scenarios
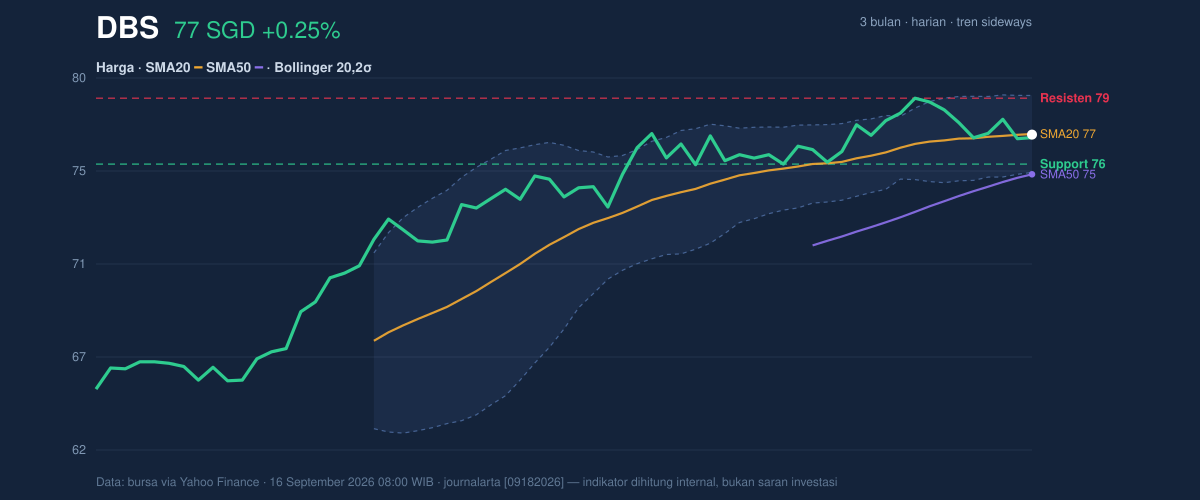
The nearest technical floor is support at 75.56. That level matters because it sits below the current price, close enough to act as a real test if sellers regain control, but above the SMA50 at 75.08, which gives the broader trend a second line of defense. On the upside, resistance at 78.65 is the first barrier, followed by the Bollinger upper band at 78.77. These levels are tightly clustered, which increases their importance: if price clears one, the next area tends to be tested quickly.
If DBS holds above 75.56 and starts to reclaim the SMA20 at 76.97, the chart would shift from neutral to mildly constructive. If it fails to hold 75.56, the market would likely refocus on the SMA50 at 75.08, where the longer trend defense becomes more relevant. A move through 78.65 would be the clearest sign that the squeeze is resolving upward, while rejection there would keep the stock trapped in its current band.
Technical Verdict: HOLD (wait & see)
HOLD (wait & see) fits best because the chart is balanced: price is below the SMA20 but above the SMA50, RSI is neutral at 52.8, and MACD remains negative even as volatility compresses. The squeeze in the Bollinger Bands suggests a larger move may be coming, but volume is below average and OBV is falling, so the market has not yet shown conviction.
- Ideal Entry Range: 75.56 to 76.97
- Exit Target: 78.65 to 78.77
- Stop Loss protection: below 75.08
This verdict is invalidated if price falls below 75.56, because that would weaken the nearest support and put the SMA50 at 75.08 under pressure. For non-traders, the message is simple: DBS is holding its ground, but the chart is still waiting for proof that the next move has real strength behind it.
Summary Data DBS
| Last price | 76.94 SGD |
| Change 1 day / 5 days / 1 month | 0.25% / -0.72% / 1.24% |
| Trend / MA-cross | sideways / none |
| SMA20 / SMA50 | 76.97 / 75.08 |
| RSI (14) / Stochastic %K | 52.8 / 38.4 |
| Bollinger %B / ATR | 49% / 0.92 |
| Support / Resistance 20 days | 75.56 / 78.65 |
| Data as of | 16 September 2026 08:00 WIB |

