OCBC Stock Gains 0.90%, Momentum Weakens In Focus
On September 18, 2026: price 31.28 SGD, trend sideways, RSI 52.1, support 30.78, resistance 32.27. technical analysis of ocbc stock. OCBC Stock Gains — full…

OCBC Bank’s shares edged up to 31.28 SGD in the latest SGX session, a modest 0.90% rise from the previous close, but the bigger message from the chart is not the one-day gain. The stock remains in a sideways trend, trading below its SMA20 at 31.42 while staying comfortably above the SMA50 at 30.14, which tells traders the medium-term floor is still intact even as short-term momentum has softened. As shown in the chart, OCBC is sitting near the middle of its recent band rather than pressing a breakout, and that positioning matters more than the headline move.
Trend & Price Action
The current setup is best read as consolidation rather than trend acceleration. The lack of a new MA-cross means there is no fresh moving-average signal to reprice the stock’s direction, and the very gentle SMA20 slope of 0.05% over 5 days reinforces that this is a market waiting for a catalyst. Price is also only 34% through the 20-hour range, which suggests the session’s strength has been contained rather than extended. That is consistent with the broader picture: OCBC is trading below its short-term average, but not far enough below it to imply outright weakness, especially with the 3-month high at 32.57 still within reach if buyers regain control.
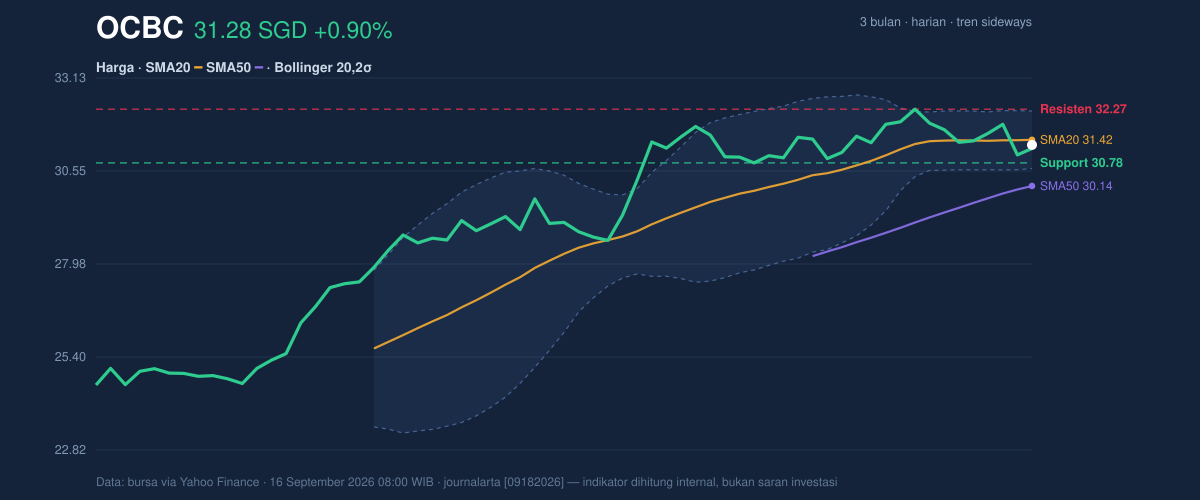
The key point in this section is that 31.28 SGD is not a breakdown level, but it is also not yet a convincing reclaim of short-term trend territory. The stock is effectively boxed between nearby support and resistance, and that kind of structure often produces sharp moves once one side gives way.
Oscillators & Momentum
The momentum indicators are sending a mixed but useful signal. The RSI at 52.1 is neutral, which means the stock is neither overbought nor oversold on a broad momentum basis. That neutrality matters because it leaves room for movement in either direction without an immediate technical exhaustion warning. More interesting is the Stochastic reading of 19.2 / 28.7, which puts the stock in oversold territory. In plain English, that often means recent selling has been enough to stretch the price lower than its short-term average pace, but it does not guarantee a rebound on its own.
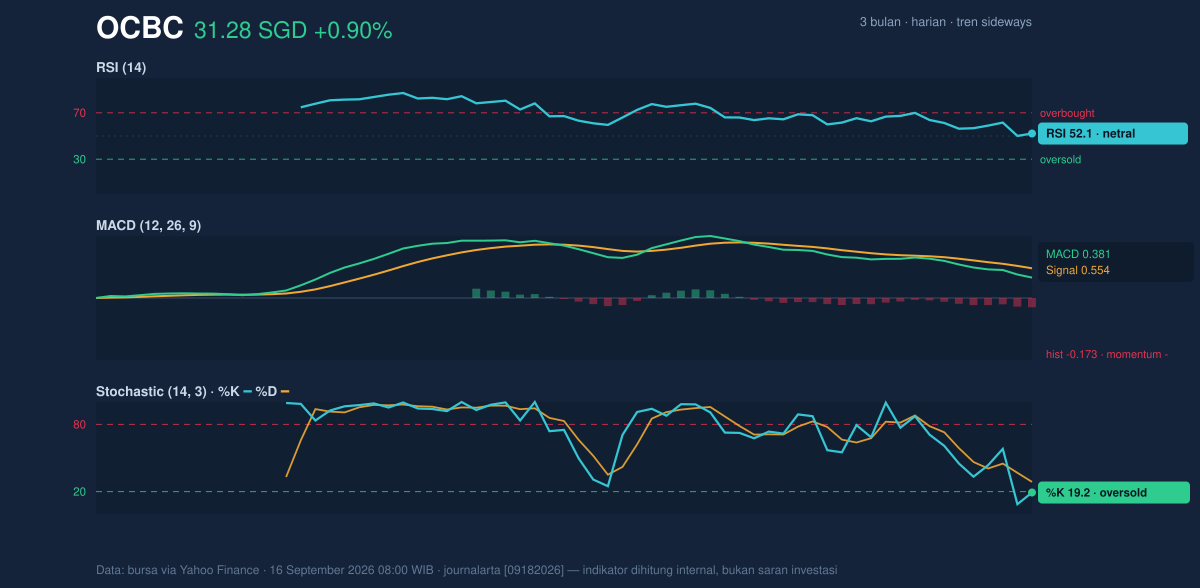
The caution flag is the MACD at 0.381 versus signal 0.554, with a -0.173 histogram. That combination shows momentum is still negative, because the faster line remains below the signal line. In practical terms, the stock may be stabilizing, but the trend-following indicator has not yet confirmed a clean turn higher. This is why the oversold Stochastic should be treated as a possible early warning of fatigue in the down-move, not as proof of a reversal.
Volatility & Volume
Volatility is not elevated, but it is not dead either. The ATR of 0.52, equal to 1.7% of price, points to a stock that can move enough in a session to matter, without the kind of whipsaw often seen in distressed names. The more important volatility clue is the Bollinger Band width of 5.1%, which is narrowing. A squeeze like this often means the market is compressing before a directional break, and because OCBC is currently below the Bollinger middle band at 31.42, the next move will likely be judged first by whether price can reclaim that midpoint.
The volume backdrop offers partial confirmation. Last turnover was 5,708,300, just above the 20-hour average of 5,399,085, or 1.1x normal. That is not aggressive participation, but it does show traders are still engaged rather than abandoning the name. The OBV is rising, which is a constructive sign because on-balance volume tracks whether money is generally flowing into or out of the stock. Rising OBV alongside a flat price often hints that underlying demand is quietly improving, even if the chart has not broken out yet.
Key Levels & Scenarios
The immediate map is straightforward. Support at 30.78 is the first level to watch, while resistance at 32.27 is the nearest ceiling. Because the stock is trading in the lower third of that range, the market is still leaning cautious, but not decisively bearish. A move back above the SMA20 at 31.42 would be the first sign that sellers are losing grip, while a failure to hold 30.78 would expose the lower band area around 30.62, where the Bollinger lower band sits.
The broader range also matters. The 3-month low at 24.36 remains far below current levels, so the long-term floor is not under immediate threat. At the same time, the 3-month high at 32.57 is close enough to act as a practical test of upside conviction if resistance at 32.27 is cleared. That makes the current setup less about a full trend call and more about whether the stock can escape compression.
Technical Verdict: HOLD (wait & see)
HOLD (wait & see) is the cleanest read from the indicators because the chart is compressed, momentum is mixed, and price has not yet reclaimed the short-term trend line.
- Reason 1: Price is below SMA20 at 31.42, so short-term trend control has not been regained.
- Reason 2: Stochastic is oversold, but MACD remains negative, so momentum is not fully aligned.
- Reason 3: Bollinger Bands are squeezing, which points to a pending move rather than a confirmed direction.
- Invalidation: This verdict is invalidated if price falls below 30.78, because that would weaken the nearest support and shift attention toward the lower Bollinger band at 30.62.
- Ideal Entry Range: 30.78 to 31.42
- Exit Target: 32.27 to 32.57
- Stop Loss Protection: below 30.62
In plain English, OCBC looks like a stock that is pausing and compressing, with the next meaningful move likely to come only after it leaves the 30.78 to 32.27 range.
Summary Data OCBC
| Last price | 31.28 SGD |
| Change 1 day / 5 days / 1 month | 0.90% / -0.22% / 1.10% |
| Trend / MA-cross | sideways / none |
| SMA20 / SMA50 | 31.42 / 30.14 |
| RSI (14) / Stochastic %K | 52.1 / 19.2 |
| Bollinger %B / ATR | 41% / 0.52 |
| Support / Resistance 20 days | 30.78 / 32.27 |
| Data as of | 16 September 2026 08:00 WIB |

