Testing Support Level, HSBC Stock Drops 0.68% Today
On September 18, 2026: price 159.80 HKD, trend sideways, RSI 44.1, support 159.60, resistance 167.60. technical analysis of hsbc stock.

HSBC Holdings’ Hong Kong-listed shares closed at HKD 159.80, down 0.68% from the previous close of 160.90, and the stock is now sitting just above its near-term floor as the chart shows price pressing against the lower end of a tightening range. The message from the tape is not dramatic, but it is clear: the shares are in a sideways pattern, trading below the SMA20 at 162.93 and also under the SMA50 at 161.61, which means the recent rebound has not yet been strong enough to reclaim the short- and medium-term trend lines. With the Bollinger bands narrowing and momentum indicators split, the market is waiting for a catalyst rather than extending a trend already in motion.
Trend & Price Action
The price structure is still neutral-to-soft. HSBC’s shares are down 2.98% over 5 days and 0.31% over 1 month, which tells us the recent drift is more of a slow fade than an outright selloff. That matters because a gradual decline under a flat moving-average profile often signals consolidation, not panic. But the stock is still trading under the SMA20, and the SMA20 itself is almost flat, with a slope of just 0.02%/5 days. In plain English, that means the trend is not building upward momentum; it is merely hovering.
As shown in the chart, the share price is also near the lower edge of its recent band, with support at 159.60 and resistance at 167.60. The current price is only about 2% from that range’s lower boundary, which makes the next move more important than the current one. A break below support would suggest the market is no longer comfortable defending the recent floor, while a move back above the moving averages would show that sellers are losing control.
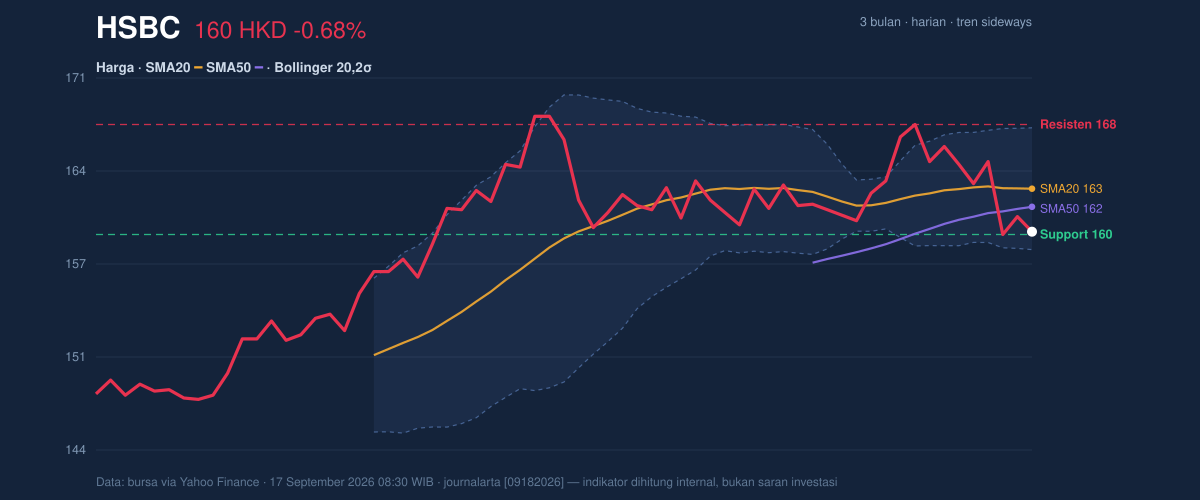
The broader context is still constructive enough to matter: the stock’s 3-month low is 145.40 and the 3-month high is 169.70, so today’s level remains in the upper half of that wider band. That is a sign the share has not broken its medium-term structure, even if the short-term tone is weak.
Oscillators & Momentum
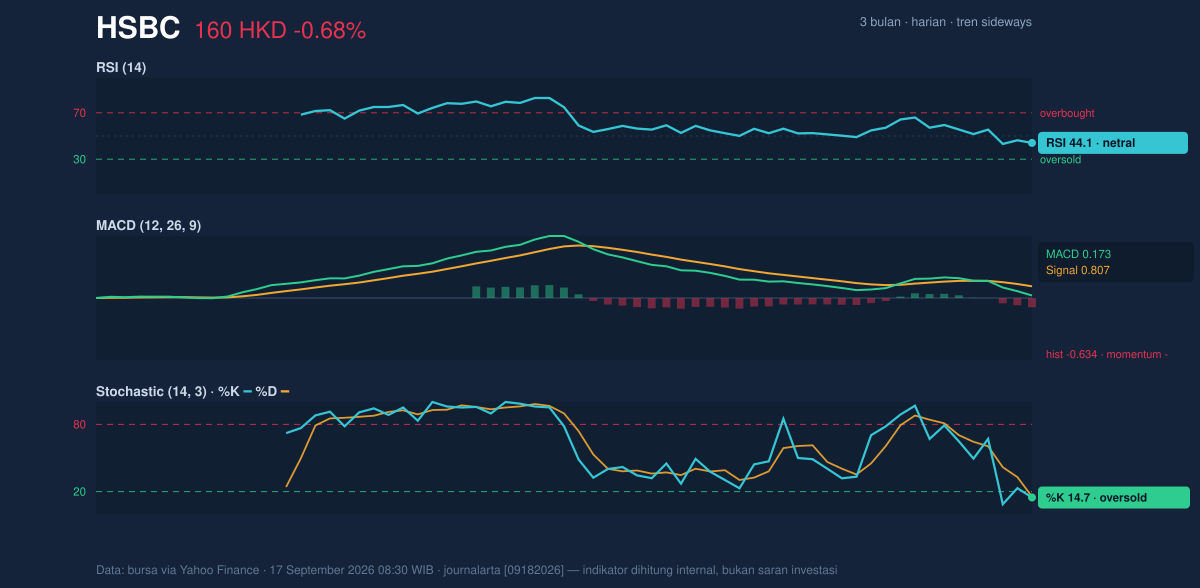
Momentum is where the picture becomes mixed. The RSI at 44.1 is neutral, which means the stock is neither overbought nor oversold by that measure. But the Stochastic %K at 14.7 and %D at 15.5 are both in oversold territory, showing the recent price drop has stretched the short-term move. For general readers, stochastic is a faster gauge than RSI: it can flag when price has fallen quickly enough to look temporarily washed out, even if the broader market is not yet ready to reverse.
The catch is the MACD is negative: the MACD line at 0.173 sits below the signal line at 0.807, leaving a -0.634 histogram. That gap means downward momentum still outweighs upward follow-through. In other words, the stock may be short-term oversold, but the trend signal has not yet flipped in a convincing way.
That combination usually points to a market that is compressed, not confirmed.
Volatility & Volume
The Bollinger setup is the most interesting part of the chart. With the band width at just 5.4%, volatility has tightened materially, and that often comes before a larger directional move. The current price is near the lower band at 158.50, while the upper band sits at 167.36. The %B at 15% shows price is positioned very close to the lower boundary of the envelope, which reinforces the idea that the stock is compressed near support rather than trending comfortably higher.
This is where the market’s internal participation matters. Last volume was 8,154,668, below the 20-day average of 10,211,463, or 0.8x normal. That means the latest dip was not accompanied by heavy selling pressure. The OBV is rising, which is a useful counter-signal: on-balance volume tracks whether more volume is occurring on up days or down days, and a rising OBV suggests accumulation is still quietly present even while price softens.
The result is a classic tension: price is weak, but volume behavior is not fully bearish.
Key Levels & Scenarios
The immediate map is straightforward. 159.60 is the first level that matters on the downside, because it is the stated support and sits just below the current price. If that gives way, the chart would lose its nearest defense and invite a test toward the lower Bollinger band at 158.50. On the upside, the first meaningful hurdle is 162.93, the SMA20 and middle Bollinger line, because reclaiming it would show the stock is moving back toward the center of its recent range. Above that, 167.60 is the key resistance, closely aligned with the upper band at 167.36 and not far from the 3-month high of 169.70.
The signal is not about predicting direction with certainty. It is about recognizing that the stock is coiled.
Technical Verdict: HOLD (wait & see)
HOLD (wait & see) is the clearest reading from the current setup.
- RSI at 44.1 is neutral, so momentum has not confirmed a reversal.
- MACD remains negative, showing downside momentum still has the upper hand.
- Bollinger bands are squeezing, which raises the odds of a sharper move, but not the direction.
- OBV is rising, which prevents the chart from turning outright bearish.
Verdict invalidated if price falls below 159.60, because that would break the nearest support and weaken the current range structure.
- Ideal Entry Range: 159.60 to 162.93
- Exit Target: 167.36 to 167.60
- Stop Loss protection: below 158.50
For non-traders, that means the shares are sitting in a tight, undecided zone where the next move matters more than the last one.
The latest 3-month high is 169.70.
Summary Data HSBC
| Last price | 159.80 HKD |
| Change 1 day / 5 days / 1 month | -0.68% / -2.98% / -0.31% |
| Trend / MA-cross | sideways / none |
| SMA20 / SMA50 | 162.93 / 161.61 |
| RSI (14) / Stochastic %K | 44.1 / 14.7 |
| Bollinger %B / ATR | 15% / 2.62 |
| Support / Resistance 20 days | 159.60 / 167.60 |
| Data as of | 17 September 2026 08:30 WIB |


