Tencent Testing Support Level: Stock Drops 1.71% (September 18, 2026)
On September 18, 2026: price 426.00 HKD, trend downtrend, RSI 40.2, support 425.60, resistance 457.00. technical analysis of tencent stock.

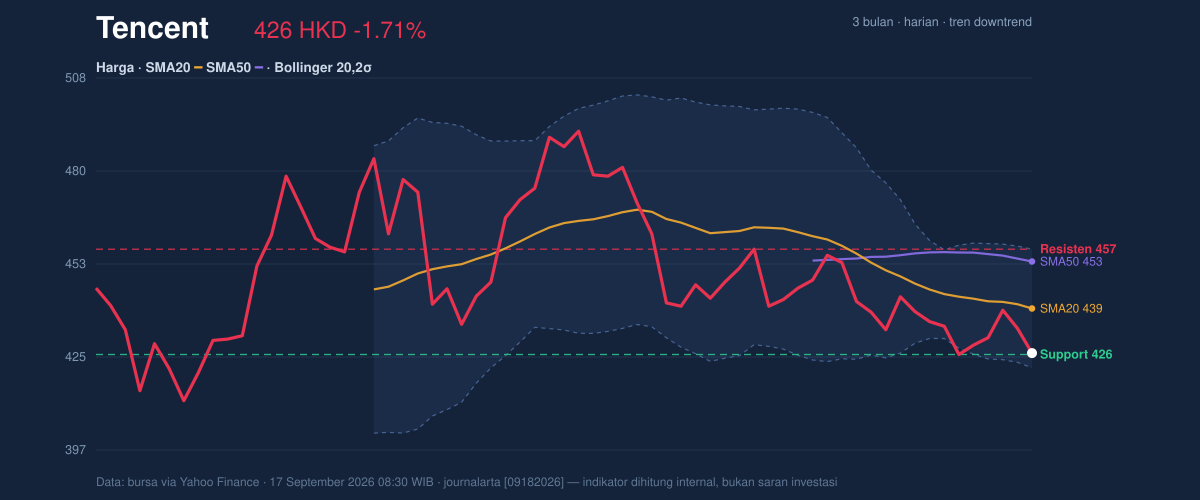
Tencent Holdings slipped on the Hong Kong exchange on 17 September 2026, with the stock last changing hands at HKD 426.00, down 1.71% from the previous close, as investors weighed a price sitting below key moving averages and near the lower edge of its short-term trading band.
The move matters less as a one-day wobble than as a signal of where the stock is trading inside its own structure. Tencent is now below the SMA20 at HKD 439.32 and further under the SMA50 at HKD 453.32, which tells the market that recent buying has not been strong enough to reclaim the average price of the past month, let alone the broader medium-term trend. The downtrend is still intact, and the SMA20 slope of -0.79% over five days shows that short-term momentum remains pointed lower rather than flattening out. The stock is also trading in the lower part of its HKD 411.00 to HKD 497.80 three-month range, which is a reminder that rallies have been capped before they can fully rebuild trend confidence.
Trend & Price Action
As shown in the chart, Tencent is hugging the lower end of its Bollinger envelope, with the lower band at HKD 421.62 and the middle band at HKD 439.32. The last price is only a short distance above the lower band, which usually means the stock is stretched on the downside but not yet in a confirmed reversal. That distinction matters: a stock can be oversold without being ready to turn. The absence of a fresh MA-cross also suggests this is not a clean trend-change setup; instead, the chart still reflects a market that has been drifting lower and has not yet produced the kind of crossover that would mark a more durable shift in direction.
The short-term support line is doing the heavy lifting here. Tencent is sitting near HKD 425.60, and the market is trading within roughly 1% of that level. That proximity says sellers have not fully broken the floor, but buyers have also not shown enough urgency to push the stock back toward the middle of the range. In plain terms: the stock is close to a test, not a breakout.
Oscillators & Momentum
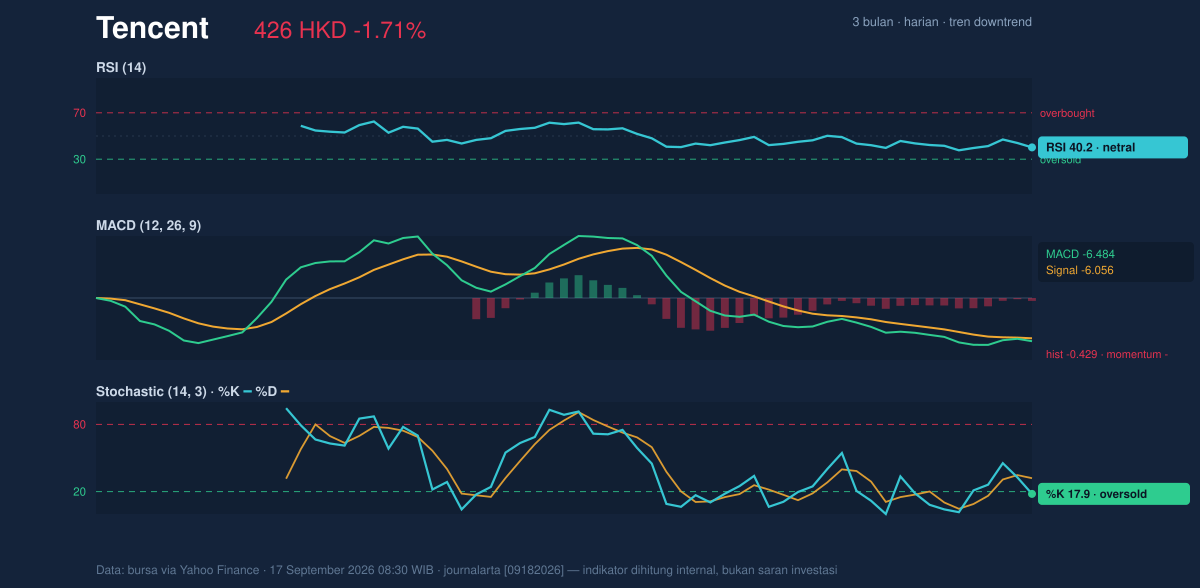
The momentum picture is mixed, and that mix is exactly what makes this name interesting rather than cleanly weak. The RSI at 40.2 is still neutral, which means the stock is not deeply oversold on a classic relative-strength basis. But the Stochastic %K at 17.9 and %D at 32.0 points to an oversold condition in the shorter-term rhythm of trading, suggesting recent declines have become more extended than average. That often brings in bargain hunters, but only if price action begins to confirm them.
The more cautionary signal comes from the MACD at -6.484, below its signal line at -6.056, with a histogram of -0.429. That combination means downside momentum is still in control, even if it is not accelerating aggressively. In other words, the stock is weak, but not in a panic slide. A negative MACD with an oversold Stochastic often creates a tension point: one indicator says “wait for strength,” while the other says “the selloff may be getting tired.” At the moment, the chart has not resolved that tension in favor of the bulls.
Volatility & Volume
Volatility is present, but not explosive. The ATR at 9.70 equals about 2.3% of the share price, which indicates a normal-to-moderate daily swing for a large-cap internet stock. That matters because it suggests moves around current levels can still be meaningful without being disorderly. The Bollinger band width of 8.1% is also described as normal, so this is not a squeeze waiting to burst or a panic expansion that usually precedes a sharp directional break. Instead, the market looks orderly, with enough room for a reaction but not enough compression to promise one.
Volume does not yet confirm a decisive turn. The latest turnover of 16,185,147 was below the 20-hour average of 18,004,754, or about 0.9x normal. That means the latest dip was not met by unusually heavy participation, which often weakens the case that sellers are in control with conviction. Still, the OBV is falling, and that is an important warning: on-balance volume tracks whether money is accumulating or leaving over time, and a declining OBV says the broader flow has been more negative than the headline price change alone might suggest.
Key Levels & Scenarios
The immediate map is straightforward. HKD 425.60 is the first support to watch, while HKD 457.00 is the first resistance. Because the stock is already near support, the market is effectively asking whether this area can hold long enough to invite a rebound toward the middle Bollinger band at HKD 439.32 and then toward resistance. If HKD 425.60 fails decisively, the next reference is the lower Bollinger band at HKD 421.62, which becomes the technical buffer before the three-month low region near HKD 411.00 comes back into view.
If price can reclaim HKD 439.32, that would be the first sign that the stock is moving back toward balance rather than simply bouncing. A sustained push through HKD 457.00 would matter more because it would show the market has recovered the near-term ceiling that has capped recent trading. Until then, the chart is still asking for proof.
Technical Verdict: HOLD (wait & see)
- The downtrend remains intact, with price below the SMA20 and SMA50, so the broader structure has not turned.
- The Stochastic is oversold, but the MACD remains negative, which means the stock is stretched without yet showing a confirmed reversal.
- Volume is below average and OBV is falling, so the latest move lacks strong participation from buyers.
Verdict invalidated if price falls below HKD 421.62, because that would mean the lower Bollinger support has failed and the next downside test becomes more likely.
- Ideal Entry Range: HKD 421.62 to HKD 426.00
- Exit Target: HKD 439.32 to HKD 457.00
- Stop Loss protection: below HKD 421.62, with the next reference near HKD 411.00
For non-traders, this means Tencent is close to a support area, but the chart has not yet shown enough strength to call the decline over.
“What happens at HKD 425.60 will decide whether this is just a pause or the start of a deeper slide.”
Summary Data Tencent
| Last price | 426.00 HKD |
| Change 1 day / 5 days / 1 month | -1.71% / 0.09% / -5.63% |
| Trend / MA-cross | downtrend / none |
| SMA20 / SMA50 | 439.32 / 453.32 |
| RSI (14) / Stochastic %K | 40.2 / 17.9 |
| Bollinger %B / ATR | 12% / 9.70 |
| Support / Resistance 20 days | 425.60 / 457.00 |
| Data as of | 17 September 2026 08:30 WIB |


