AIA Stock Technicals Today: Gains 0.45%, Golden Cross Formed
On September 18, 2026: price 77.35 HKD, trend uptrend, RSI 58.9, support 74.20, resistance 77.50. technical analysis of aia stock. AIA Stock Technicals — full…

AIA Group edged up to 77.35 HKD in Hong Kong trading, a modest 0.45% daily gain that leaves the insurer near the top of its recent range, with the shares sitting just under the 77.50 HKD resistance line, according to exchange-linked data via Yahoo Finance as of 17 September 2026, 08:30 WIB. The move matters less for its size than for its position: the stock is trading above both short- and medium-term averages, and that alignment says the recent advance is being accepted rather than quickly sold into.
Trend & Price Action
The chart shows a stock that is still climbing, but in a more mature phase of the move. Price is above the SMA20 at 75.93 and also above the SMA50 at 75.62, which is the basic footprint of an uptrend. More importantly, the golden cross — where the 20-day average has moved above the 50-day average — suggests the shorter-term trend has overtaken the longer one, a signal that often appears when momentum is broadening beyond a brief rebound. The SMA20 slope of 1.25% over 5 days reinforces that the trend is still rising rather than flattening out.
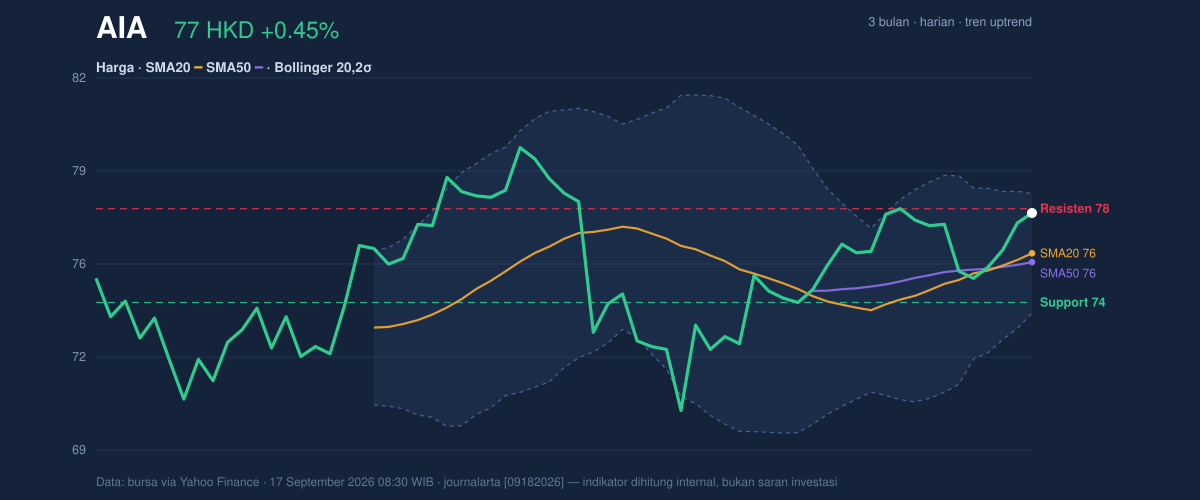
The stock is also trading near the upper end of its short-term range. 77.35 HKD sits close to the 77.50 HKD resistance and well above the 74.20 HKD support, meaning the market is testing whether buyers have enough conviction to push through the ceiling. Being at 95% of the 20-hour range is a sign of strength, but it also leaves less room for error if momentum fades. The broader 3-month range, 69.35 to 80.15, shows the stock is not yet at its prior peak, so there is still technical space above if the market chooses to extend the move.
Oscillators & Momentum
The momentum tools are constructive, but not overheated. RSI at 58.9 is neutral, which is useful because it implies the stock is advancing without being stretched into classic overbought territory. That matters in an uptrend: a neutral RSI often means the move has room to continue if fresh demand appears. The Stochastic %K at 73.9 and %D at 64.0 points to stronger short-term momentum than the RSI alone suggests, but it is still not an extreme reading. In plain language, buyers are active, though not yet in a panic to chase price.
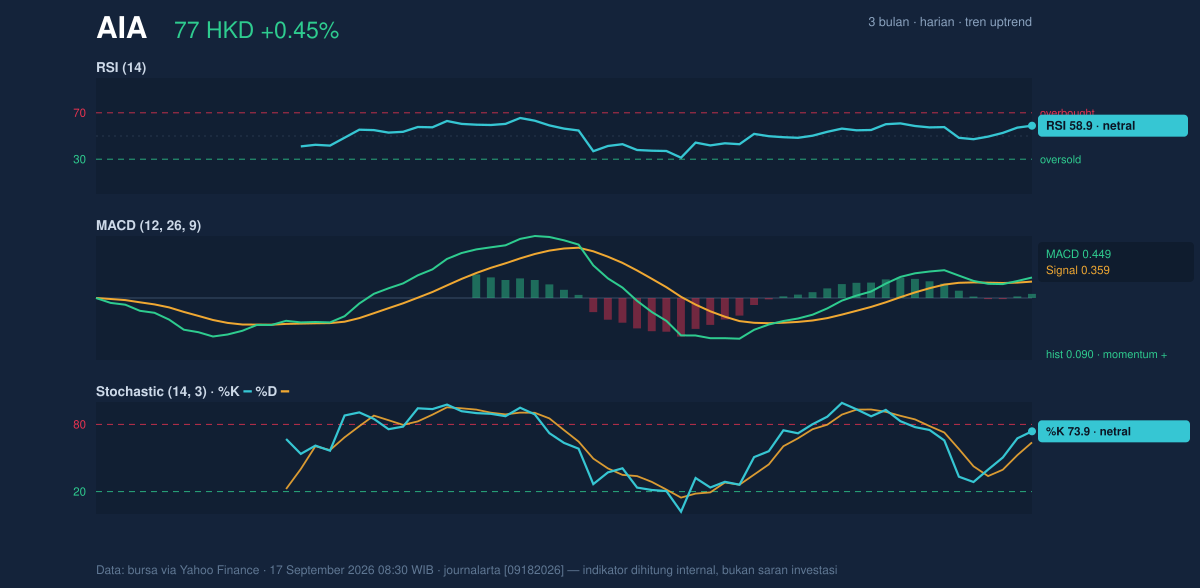
The cleaner message comes from MACD. MACD at 0.449 is above the signal line at 0.359, and the 0.090 histogram is positive. That combination means the trend is still gaining traction rather than losing it. MACD is often used to judge whether price acceleration is improving; here, it says the recent rise has not yet run out of steam. The absence of an overbought RSI reading also reduces the risk that the stock is simply drifting into a short-lived spike.
Volatility & Volume
Bollinger Bands add a more nuanced signal. The upper band at 78.03 is only slightly above the current price, while the lower band at 73.83 is not far below support. With %B at 84%, the shares are trading in the upper part of the band, which usually indicates strength but also means price is approaching the zone where traders start watching for either a breakout or a pause. The key detail is the 5.5% band width, which is described as a squeeze. A squeeze means volatility has compressed; when that happens inside an uptrend, the market is often storing energy for a sharper move, though the direction still needs confirmation.
Volatility itself is moderate rather than wild. ATR at 1.63, equal to 2.1% of price, suggests daily swings are contained enough for the trend to remain orderly. Volume is less supportive than the price action. The latest turnover of 19,176,275 is only 0.7x the 20-day average of 26,388,071, so the breakout attempt has not yet been backed by full participation. That is not a warning by itself, but it does mean the recent rise is leaning more on price structure than on a surge of trading intensity. The rising OBV, however, shows that the balance of volume has still been accumulating in the right direction.
Key Levels & Scenarios
The chart makes the decision points fairly clear. 77.50 HKD is the first level that matters on the upside; a clean move beyond it would confirm that buyers are willing to pay above the current ceiling. Above that, the 78.03 HKD Bollinger upper band becomes the next nearby marker, and then the 80.15 HKD 3-month high stands as the wider reference point. On the downside, 75.93 HKD and 75.62 HKD are the moving-average supports, while 74.20 HKD is the more visible short-term floor. A break below that support would suggest the current advance is losing grip and that the market is returning to the lower half of the recent range. As shown in the chart, the setup is balanced between a breakout attempt and a pause inside a still-positive trend.
Technical Verdict: HOLD (wait & see)
HOLD (wait & see)
- MACD remains positive, with the line above signal and a green histogram, so trend momentum is still intact.
- Golden cross and price above both SMA20 and SMA50 keep the broader setup constructive.
- Bollinger squeeze plus price near 77.50 HKD means the next move could be sharper, but volume is only 0.7x normal, so confirmation is still missing.
- Verdict invalidated if price breaks below 74.20 HKD.
- Ideal Entry Range: 75.93 to 77.50 HKD
- Exit Target: 78.03 HKD initially, then 80.15 HKD if upside extends
- Stop Loss protection: 74.20 HKD
In plain English, the chart is still positive, but it is waiting for stronger proof that the move can push through resistance.
Summary Data AIA
| Last price | 77.35 HKD |
| Change 1 day / 5 days / 1 month | 0.45% / 2.72% / 6.32% |
| Trend / MA-cross | uptrend / golden |
| SMA20 / SMA50 | 75.93 / 75.62 |
| RSI (14) / Stochastic %K | 58.9 / 73.9 |
| Bollinger %B / ATR | 84% / 1.63 |
| Support / Resistance 20 days | 74.20 / 77.50 |
| Data as of | 17 September 2026 08:30 WIB |


