Alibaba Testing Support Level: Stock Drops 2.64% (September 11, 2026)
On September 11, 2026: price 106.90 HKD, trend sideways, RSI 37.0, support 106.90, resistance 126.70. technical analysis of alibaba stock.
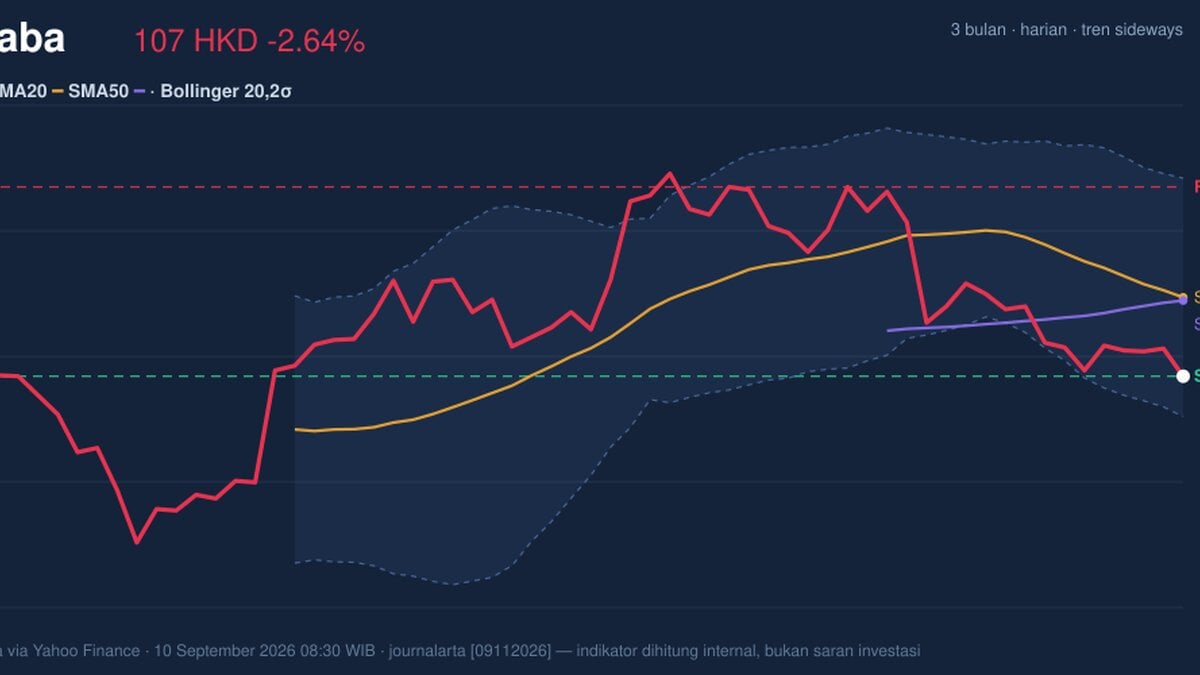
Alibaba Group’s Hong Kong-listed shares fell to HKD 106.90 on the HKEX, down from 109.80 the previous close, as the stock extended a month-long slide and tested the lower end of its recent trading range. The move leaves the shares below the 20-day and 50-day moving averages, a sign that short-term price recovery has not yet regained control, even though the stock is now pressing into an area where technical sellers often start to lose momentum.
Trend & Price Action
The broader setup remains sideways, but the direction inside that range is weak: the SMA20 is sloping down 3.17% over 5 days, and the price sitting below the SMA20 at 115.14 tells traders that recent rebounds have failed to hold. The SMA50 at 114.83 is also above the current level, so the stock is trading under both medium-term trend markers, which usually means rallies are being sold into rather than followed by fresh demand.
There is no new moving-average crossover, so the chart is not giving a clean trend-reversal signal. Instead, it is showing a market that has drifted lower within a broad range, with the latest print near the lower band of that range. The 3-month high of 130.30 and 3-month low of 88.65 frame the bigger picture: Alibaba is still well above the floor, but it has surrendered a meaningful part of the rebound that carried it toward the top of that band.
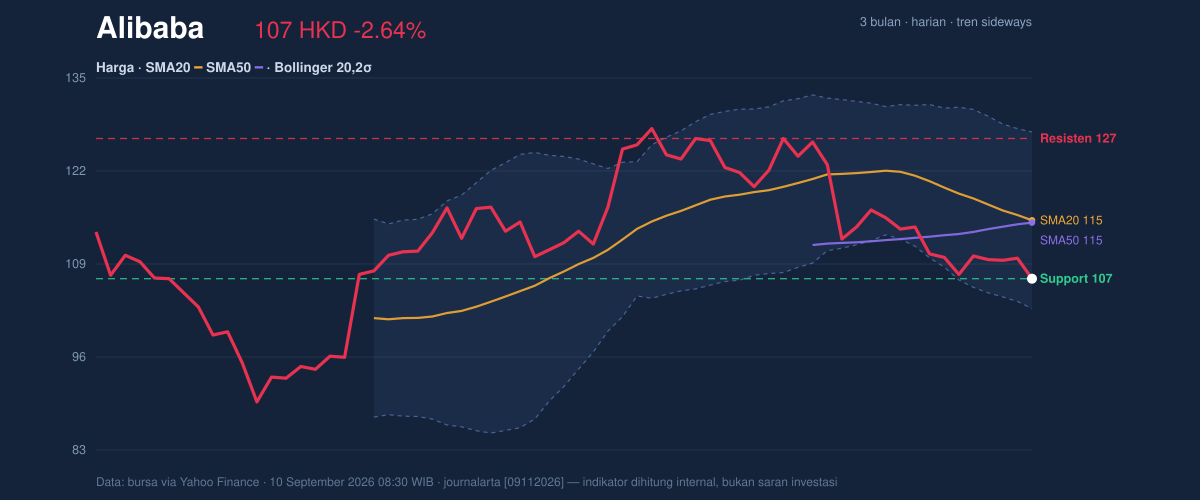
One important signal here is not just that price is down, but that it is down while the trend measures remain overhead. That combination usually means the market is still proving whether support is real.
Oscillators & Momentum
The momentum picture is mixed, but not encouraging enough to call a turn. RSI at 37.0 is not yet in oversold territory, but it is close enough to show that bearish pressure has been persistent. More importantly, the Stochastic %K and %D both at 13.5 indicate the stock is oversold, which often means downside may be stretched in the very short term. That does not guarantee a bounce; it simply says the move has become extended enough that traders may start watching for stabilization.
The bigger problem is the trend confirmation from MACD. With MACD at -2.573, below the signal line at -1.539, and a histogram of -1.034, momentum is still negative and accelerating to the downside. In plain language: the stock is not only weak, it is still weakening faster than the trend signal can catch up. That is why the oversold stochastic reading should be treated as a potential pause signal, not a reversal signal.
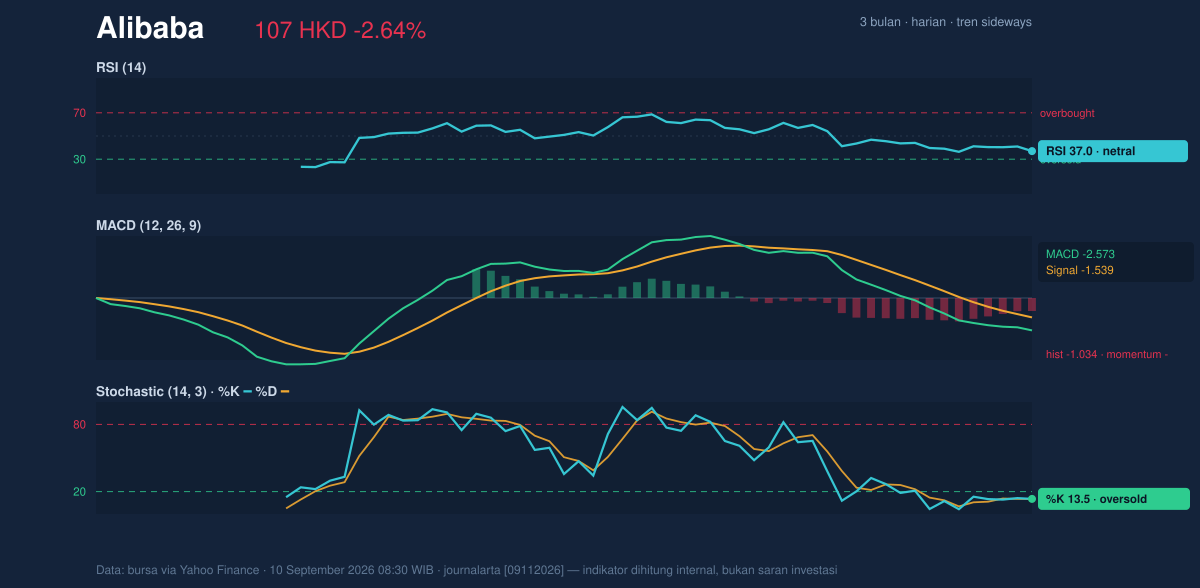
The chart is telling a familiar story: short-term exhaustion can appear before a real trend change, but the trend itself has not yet flipped.
Volatility & Volume
Volatility is elevated. The Bollinger Bands are wide, with the upper band at 127.61, the middle at 115.14, and the lower at 102.67; the 21.7% band width shows the stock is in a high-variance environment. The current price sits at a very low %B of 17%, meaning it is trading close to the lower band rather than the center of the range. That matters because when a stock hugs the lower Bollinger Band while momentum is negative, it usually signals either continued weakness or a sharp but fragile bounce.
The ATR(14) of 3.98, equal to 3.7% of price, reinforces that the daily trading range is still large. In practical terms, a move of several Hong Kong dollars in either direction would not be unusual. That kind of volatility can make support tests more important, because once a level breaks, price can travel quickly.
Volume, however, does not yet confirm a capitulation move. The latest volume of 65,902,181 was only 0.7× the 20-day average of 97,122,640, and OBV is falling. OBV, or on-balance volume, tracks whether volume is flowing with price or against it; a falling OBV means distribution is still outweighing accumulation. In other words, the market is not showing the kind of heavy participation that often marks a durable bottom.
Low volume on a down day can mean apathy. Falling OBV means it is more than that.
Key Levels & Scenarios
The immediate support is 106.90, which is also the latest price and places Alibaba right on the edge of its short-term floor. The next reference below that is the Bollinger lower band at 102.67. On the upside, the nearest resistance is 126.70, with the Bollinger upper band at 127.61 sitting just above it. Because the price is at 0% of the 20-hour range, the market is effectively testing the bottom of the recent box rather than trading in the middle of it.
If 106.90 holds and momentum starts to improve, a move back toward 114.83 to 115.14 would simply be a return to the moving-average zone, not yet a full trend repair. If 106.90 fails, the chart opens toward 102.67, where the lower Bollinger Band becomes the next technical checkpoint. A recovery above 115.14 would matter because it would put price back above the short-term trend line; a move through 126.70 would be needed to challenge the upper part of the range.
Technical Verdict: HOLD (wait & see)
HOLD (wait & see) is the clearest reading from the chart because the stock is oversold, but not yet showing confirmed reversal behavior.
- Reason 1: MACD remains negative at -2.573, with the histogram still below zero, so downside momentum is not yet exhausted.
- Reason 2: Price is below both SMA20 and SMA50, which means the short- and medium-term trend structure is still under pressure.
- Reason 3: Stochastic is oversold at 13.5/13.5, but OBV is falling and volume is only 0.7× normal, so there is no strong participation signal behind a rebound.
- Verdict invalidated if price breaks below 102.67, the lower Bollinger Band and the next visible technical support.
- Ideal Entry Range: 102.67 to 106.90
- Exit Target: 114.83 to 115.14
- Stop Loss protection: below 102.67
For non-traders: the chart says the stock is cheap relative to recent trading, but it has not yet shown enough proof that the decline has stopped.
Summary Data Alibaba
| Last price | 106.90 HKD |
| Change 1 day / 5 days / 1 month | -2.64% / -0.56% / -12.31% |
| Trend / MA-cross | sideways / none |
| SMA20 / SMA50 | 115.14 / 114.83 |
| RSI (14) / Stochastic %K | 37.0 / 13.5 |
| Bollinger %B / ATR | 17% / 3.98 |
| Support / Resistance 20 days | 106.90 / 126.70 |
| Data as of | 10 September 2026 08:30 WIB |
Track Alibaba share price daily: live levels, support/resistance and our full Alibaba analysis history.