Genting Singapore Stock Drops 0.83% on Friday, RSI Oversold
On October 23, 2026: price 0.60 SGD, trend downtrend, RSI 29.6, support 0.60, resistance 0.63. technical analysis of genting singapore stock.
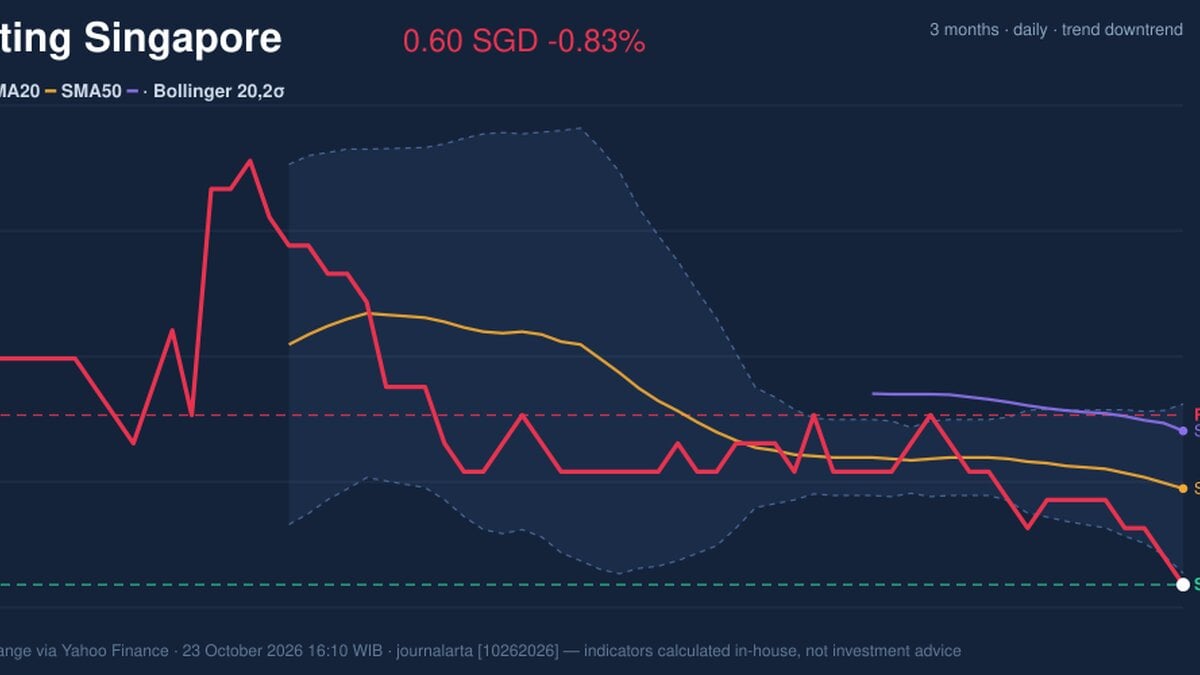
Why Genting Singapore is in focus today
- Volume at 1.9× the 20-day average
- Closed at a 20-day low (0.60)
- Trading near its 3-month low (0.59)
- RSI(14) at 29.6 — oversold zone
- Breaking out of a Bollinger squeeze (band width 4.9%)
- Downtrend extending (5-day change -2.46%)
Selected automatically from 16 SGX (Singapore) stocks by a technical-signal score with daily weighted randomisation — not a recommendation.
Trend & Price Action
The share price is below both its SMA20 at S$0.61 and SMA50 at S$0.62. The 20-day average is also sloping lower, down 0.61% over five days, while no new moving-average crossover has formed. In plain terms, the recent weakness has not yet been reversed by the price structure. Genting Singapore is at the bottom of its 20-day trading range, with S$0.60 support and S$0.63 resistance. It is also close to the three-month low of S$0.59, while the period’s high was S$0.68. The proximity to the low makes support a key test: holding the area could allow a pause, but a break would mean the share price has moved below its recent floor. As shown in the chart, the price is pressing the lower Bollinger Band while the averages remain overhead.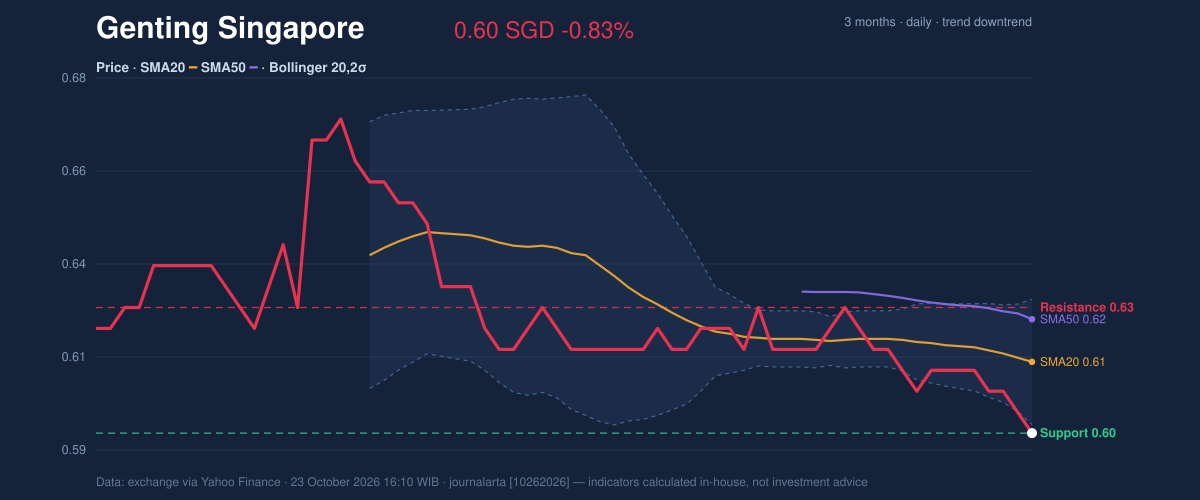
Oscillators & Momentum
The RSI at 29.6 and Stochastic readings of 14.3 and 17.0 are both in oversold territory. These measures indicate that the recent decline has been steep relative to the indicators’ lookback periods. They can flag conditions in which selling has become stretched, but they do not by themselves establish that a bottom is in place. The MACD remains negative, at -0.005 against a -0.004 signal line, with a -0.001 histogram. That means short-term momentum still favours the downside rather than confirming a turn. The oversold readings and negative MACD therefore tell different parts of the same story: the decline may be extended, but selling pressure has not yet been technically reversed.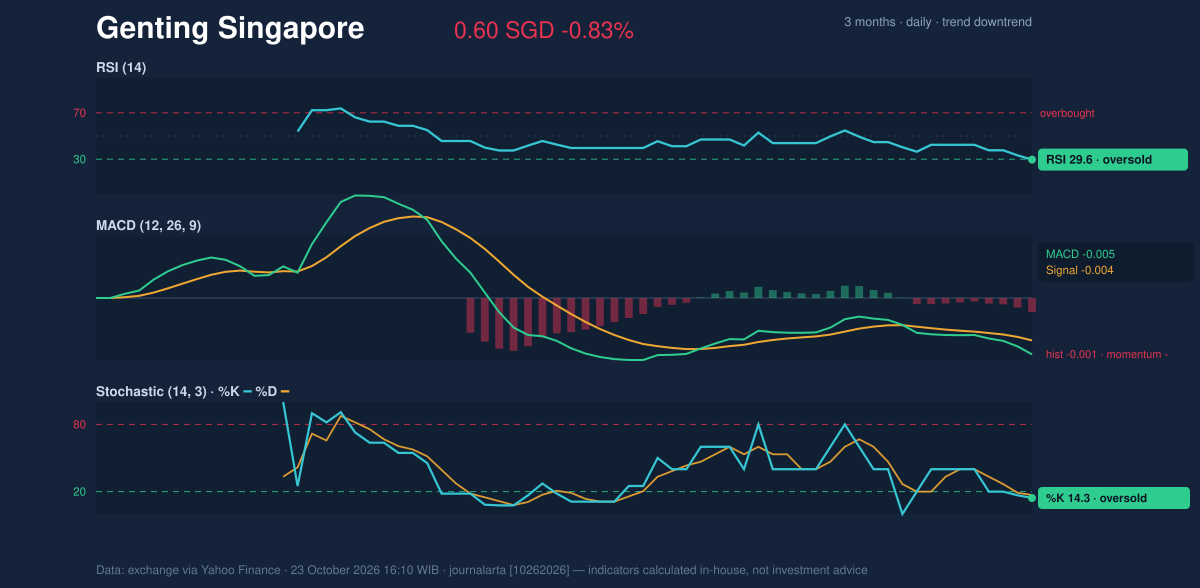
Volatility & Volume
The Bollinger Band width has narrowed to 4.9%, a squeeze that can precede a larger price move but does not reveal its direction. The price’s %B reading of -7% places it below the lower band, underscoring how stretched the latest move is. Because the bands are tight, a breakout could bring a more pronounced move; confirmation from price and volume will matter more than the squeeze alone. Volume reached 33.34 million shares, against a 20-day average of 17.57 million. That is a substantial pickup in participation on a day when the stock remained at its 20-day low. Meanwhile, OBV is falling. OBV, or on-balance volume, tracks whether volume is accumulating on rising sessions or distributing on falling ones; its decline suggests the heavier activity has not yet shown clear accumulation. ATR is S$0.01, or 1.9% of the share price, pointing to moderate recent daily price variation. Near support, that still leaves room for meaningful movement relative to the narrow S$0.60–S$0.63 range.Key Levels & Scenarios
The immediate test is S$0.60, with the three-month low at S$0.59 just below it. A sustained hold above this area, followed by a move back over the SMA20 at S$0.61, would offer initial evidence that selling is easing. A break below S$0.59 would undermine that case and place the shares beneath the cited three-month floor. On the upside, S$0.63 is the near-term resistance and the upper Bollinger Band. A move through it would be a stronger sign of recovery than an oversold reading alone, particularly if volume and OBV also improve. Until then, the declining averages and negative MACD remain obstacles.Technical Verdict: HOLD (wait & see)
The technical balance supports HOLD (wait & see) rather than a directional call. First, RSI and Stochastic are oversold, which signals an extended decline but not a confirmed reversal. Second, price remains below the falling SMA20 and SMA50, while MACD is negative. Third, the volume surge came alongside falling OBV and a close at the 20-day low, so the activity has not yet confirmed buying demand. The verdict is invalidated if the price falls below S$0.59, the three-month low.- Ideal entry range: S$0.60–S$0.61, around the 20-day support and SMA20; the technical case would require support to hold.
- Exit target: S$0.63, the 20-day resistance and upper Bollinger Band.
- Stop-loss protection: Below S$0.59, the three-month low.
Summary Data Genting Singapore
| Last price | 0.60 SGD |
| Change 1 day / 5 days / 1 month | -0.83% / -2.46% / -3.25% |
| Trend / MA-cross | downtrend / none |
| SMA20 / SMA50 | 0.61 / 0.62 |
| RSI (14) / Stochastic %K | 29.6 / 14.3 |
| Bollinger %B / ATR | -7% / 0.01 |
| Support / Resistance 20 days | 0.60 / 0.63 |
| Data as of | 23 October 2026 16:10 WIB |
Disclaimer: This technical analysis is generated automatically from exchange data (via Yahoo Finance) and indicators calculated by JournalArta, for information and education only. The verdict and the entry, target and stop-loss levels are not investment advice or a solicitation to buy or sell any security. Investment decisions and their risks rest solely with the reader.
Track Genting Singapore share price daily: live levels, support/resistance and our full Genting Singapore analysis history.