CNOOC Stock Technicals: Drops 1.03% on Friday, Testing Support Level
On October 23, 2026: price 23.12 HKD, trend sideways, RSI 39.2, support 23.12, resistance 24.72. technical analysis of cnooc stock. CNOOC Stock Technicals —…
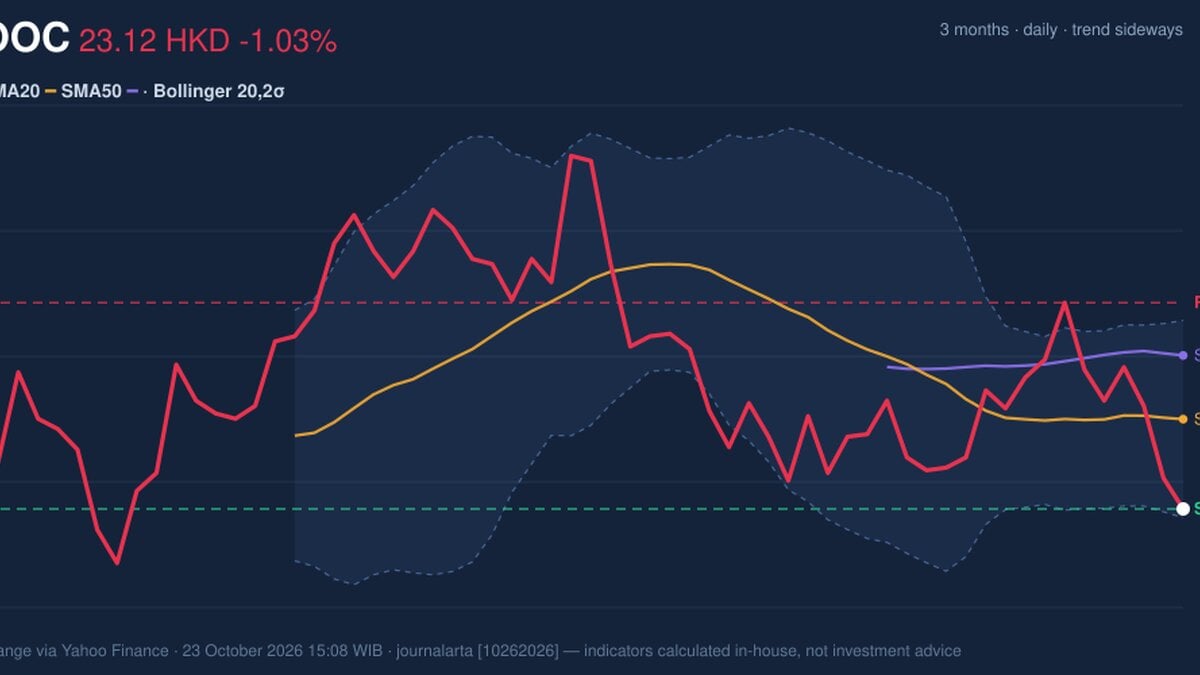
Why CNOOC is in focus today
- Closed at a 20-day low (23.12)
- MACD histogram has just turned negative
Selected automatically from 16 HKEX (Hong Kong) stocks by a technical-signal score with daily weighted randomisation — not a recommendation.
Trend & Price Action
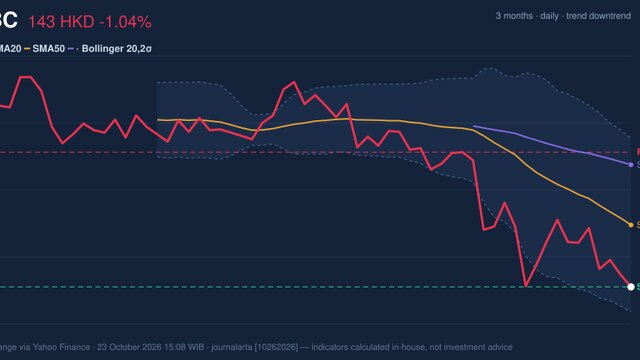
At HK$23.12, CNOOC is below its SMA20 of HK$23.82 and SMA50 of HK$24.31. The SMA20 is nearly flat, rising just 0.03% over five days, so the broader technical picture is sideways rather than a firmly established downtrend. But the share price sitting beneath both averages indicates that sellers currently have the upper hand: those averages may act as overhead resistance if the stock attempts to recover. There has been no recent moving-average crossover to signal a decisive change in trend. Instead, the price has reached the lower edge of its 20-day range, with HK$23.12 support and HK$24.72 resistance. The three-month range, from HK$22.52 to HK$26.00, places the current price closer to its low than its high. As shown in the chart, the price is also near the lower Bollinger Band. This can mark a stretched decline, but it does not by itself confirm that a rebound has begun.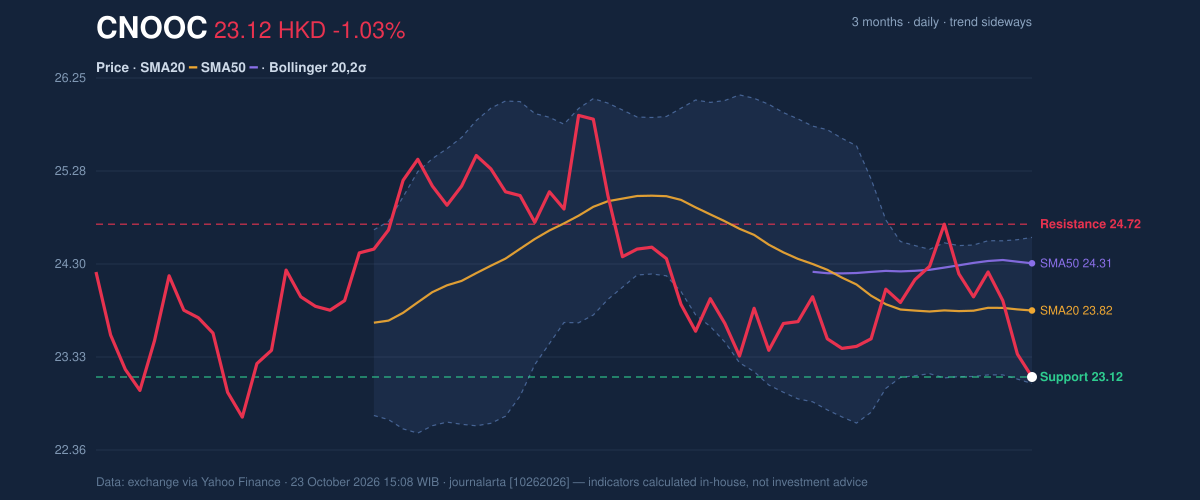
Oscillators & Momentum
The indicators present a mixed picture. RSI at 39.2 is neutral, below the level that would usually indicate strong positive momentum but not, on its own, an oversold reading. The Stochastic oscillator is more stretched: %K at 13.3 and %D at 25.5 are in oversold territory, suggesting the recent selling has been pronounced. Oversold conditions can precede a bounce, yet they can also persist while a share price remains weak. The MACD adds a cautionary signal. MACD is -0.136, below its -0.092 signal line, with a -0.044 histogram, showing negative momentum. The histogram’s turn below zero is especially relevant because it indicates that the balance of short-term momentum has shifted lower. A sustained improvement would require that pressure to ease, not merely a low Stochastic reading.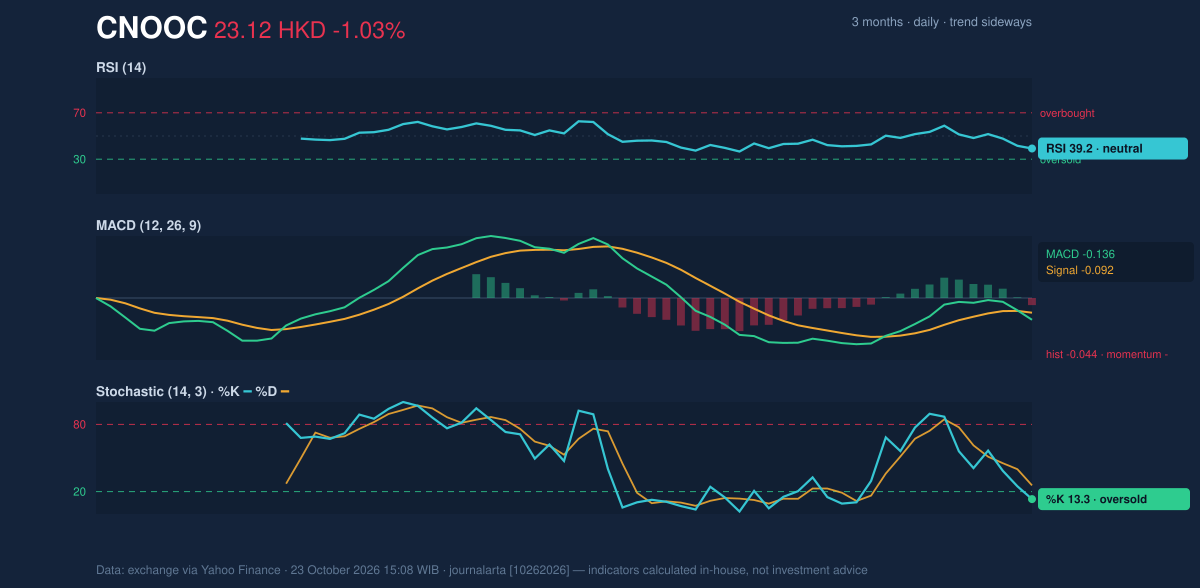
Volatility & Volume
The Bollinger Bands are narrowing, with a width of 6.4%. A squeeze means recent price movement has become more compressed; it can precede a larger move, but does not predict its direction. The %B reading of 4% places the price close to the lower band, at HK$23.05, reinforcing the picture of a share under pressure near the bottom of its recent range. Average True Range, or ATR, is HK$0.64, equivalent to 2.8% of the price, indicating moderate daily volatility. Volume reached 93.1 million shares against a 20-day average of 70.4 million. That above-normal turnover alongside a falling price suggests the decline had meaningful market participation. OBV, a measure that tracks whether volume is flowing more into rising or falling sessions, is also down, offering no confirmation of accumulation.Key Levels & Scenarios
The immediate test is HK$23.12, the stated 20-day support and the latest closing price. A break below it would weaken the near-term structure and expose the stock to renewed pressure toward its three-month low of HK$22.52. If support holds, oversold Stochastic readings could accompany a stabilisation, but the first hurdle is the lower Bollinger Band at HK$23.05 and then the SMA20 at HK$23.82. Resistance stands at HK$24.72; a move above it would be needed to challenge the present range more convincingly.Technical Verdict: HOLD
The technical balance supports HOLD (wait & see) rather than a directional call. The strongest reasons are the negative MACD momentum and falling OBV, countered by an oversold Stochastic reading near support and a narrowing Bollinger squeeze. The verdict is invalidated if the price falls below HK$23.12.- Ideal entry range: HK$23.05–HK$23.12, around the lower Bollinger Band and stated support.
- Exit target: HK$24.72, the stated 20-day resistance.
- Stop-loss protection: HK$22.52, the three-month low.
Summary Data CNOOC
| Last price | 23.12 HKD |
| Change 1 day / 5 days / 1 month | -1.03% / -4.46% / -0.94% |
| Trend / MA-cross | sideways / none |
| SMA20 / SMA50 | 23.82 / 24.31 |
| RSI (14) / Stochastic %K | 39.2 / 13.3 |
| Bollinger %B / ATR | 4% / 0.64 |
| Support / Resistance 20 days | 23.12 / 24.72 |
| Data as of | 23 October 2026 15:08 WIB |
Disclaimer: This technical analysis is generated automatically from exchange data (via Yahoo Finance) and indicators calculated by JournalArta, for information and education only. The verdict and the entry, target and stop-loss levels are not investment advice or a solicitation to buy or sell any security. Investment decisions and their risks rest solely with the reader.
Track CNOOC share price daily: live levels, support/resistance and our full CNOOC analysis history.