Death Cross Pressure, HSBC Stock Gains 0.06% Today
On September 30, 2026: price 159.00 HKD, trend downtrend, RSI 45.0, support 156.90, resistance 167.60. technical analysis of hsbc stock.

At HKEX, HSBC Holdings changed hands at HKD 159.00 on 29 September 2026 at 08:30 WIB, barely above the prior close of 158.90, but still sitting below its short- and medium-term trend lines. The share is trading in a technically fragile zone: the stock is under its SMA20 at 161.94 and SMA50 at 162.23, while the chart has already printed a death cross — a pattern where the 20-day average falls below the 50-day average, usually read as a sign that recent price momentum has weakened relative to the broader short-term trend. The message from the tape is not dramatic, but it is clear: HSBC is not in a breakout phase; it is in a consolidation phase with a downward bias.
Trend & Price Action
As shown in the chart, the share price is positioned in the lower half of its recent range and is trading below the two averages that often act as dynamic resistance. That matters because when price stays beneath both the SMA20 and SMA50, rallies tend to run into sellers sooner than buyers would like. The slope of the SMA20 at -0.45% over 5 days reinforces that the short-term trend is still leaning lower rather than flattening out. HSBC is also near the lower end of its 3-month range, with the stock between a 3-month high of 169.70 and 3-month low of 145.40. In plain language, the market has already repriced the shares lower, but it has not yet shown a decisive reversal.
The fact that the stock is only slightly above the previous close can be misleading. A near-flat daily move does not cancel the broader technical weakness.
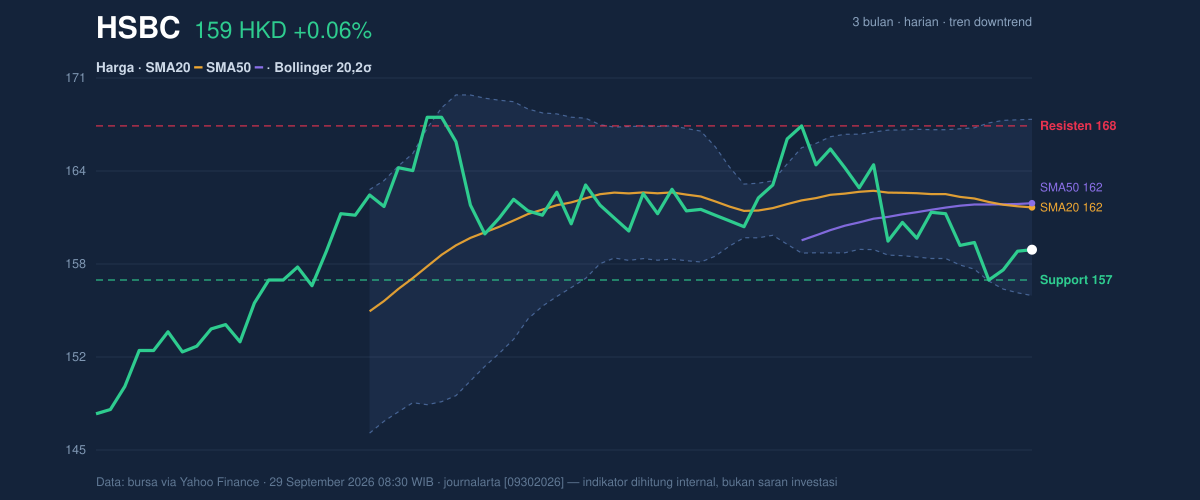
The Bollinger Bands help explain why the chart feels compressed. With the upper band at 168.06, the middle band at 161.94, and the lower band at 155.82, HSBC is trading below the midpoint and closer to the lower half of the band structure. The %B of 26% means price is sitting closer to the lower band than the upper band, which usually signals that the market is weak but not yet oversold enough to force a rebound. The 7.6% band width shows the bands are tightening, a classic squeeze condition that often precedes a larger move. A squeeze does not tell direction on its own; it tells readers that the current calm may not last.
Oscillators & Momentum
Momentum is mixed, but not in a way that offsets the bearish trend structure. The RSI at 45.0 is neutral, which means the stock is neither overbought nor oversold. That is important because it shows there is still room for price to move either way without immediately hitting an oscillator extreme. The Stochastic %K at 35.1 and %D at 27.0 also sit in neutral territory, though they are closer to the lower part of the range, hinting that short-term pressure has been softer than ideal. The key signal, however, comes from the MACD at -0.982, with the signal line at -0.452 and the histogram at -0.530. That combination means downside momentum is still active: the MACD line is below the signal line, and the negative histogram shows the gap has not yet closed.
In simple terms, the oscillators are not screaming “oversold bounce,” but they are also not confirming a clean recovery.
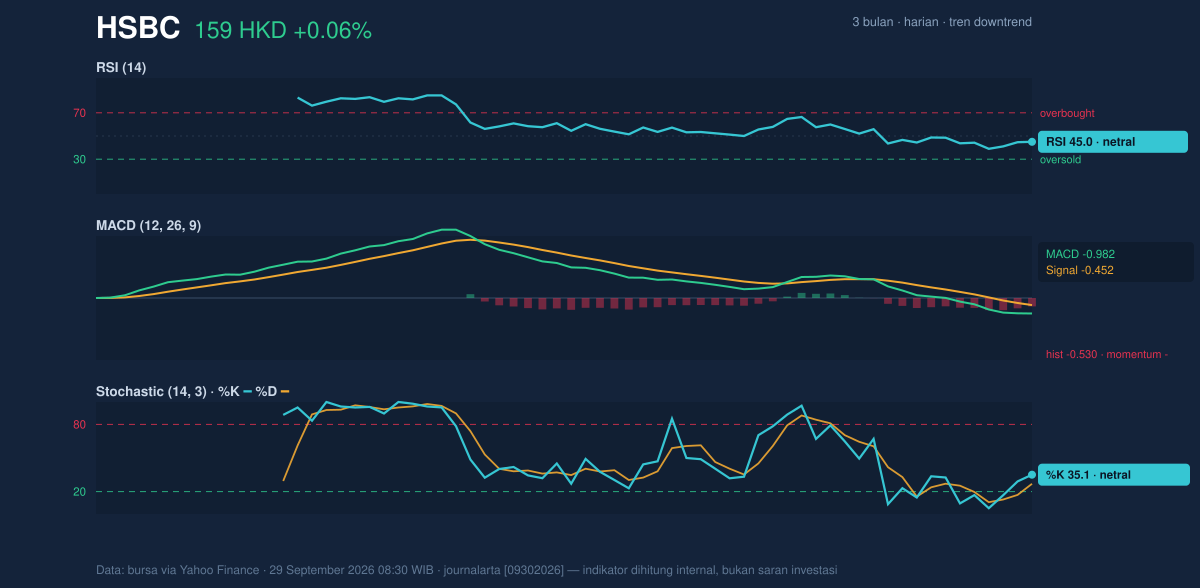
This is the kind of setup where a stock can drift sideways for a while, then move sharply once the compression resolves. The problem for bulls is that momentum has not yet turned up decisively enough to challenge the broader downtrend.
Volatility & Volume
Volume was 10,730,754, almost exactly in line with the 20-day average of 10,775,571, which means the latest move was not powered by unusually strong participation. That matters because price changes driven by average volume can be less convincing than those backed by a clear surge in trading activity. The OBV is rising, though, and that is the one constructive sign in the volume picture. OBV, or on-balance volume, tracks whether volume is accumulating on up days or distributing on down days; a rising OBV suggests buyers have been quietly participating even if price has not yet broken higher.
ATR at 2.80, or 1.8% of price, points to moderate volatility. This is not a highly unstable name at the moment, but it is volatile enough for a squeeze breakout to matter once direction is chosen. The market is essentially coiling.
Key Levels & Scenarios
The nearest technical floor is 156.90, the 20-day support level. That line is important because it sits just above the lower Bollinger band at 155.82; a break below both would suggest the stock is losing the last layer of near-term support. On the upside, the first ceiling is 167.60, the 20-day resistance, which sits below the upper Bollinger band at 168.06. That makes the 167.60-168.06 area a meaningful test zone: if price can reclaim it, the chart would begin to look less defensive.
If HSBC holds above 156.90 and the MACD histogram starts to narrow, the stock could attempt a move back toward 161.94 and then 162.23, where the two moving averages cluster. If it fails to hold 156.90, the chart opens room toward the lower band at 155.82, with the 3-month low at 145.40 becoming the broader downside reference.
Technical Verdict: HOLD (wait & see)
HOLD (wait & see) is the cleanest reading because the chart is caught between a weakening trend and a narrowing volatility band.
- Death cross and price below both SMA20 at 161.94 and SMA50 at 162.23 keep the trend bearish.
- MACD remains negative at -0.982, with the histogram still below zero, showing downside momentum has not fully faded.
- Bollinger Bands are tightening with a 7.6% width, which suggests a directional move may be coming, but the chart has not confirmed direction yet.
Verdict invalidated if price breaks below 156.90, because that would weaken the nearest support and raise the chance of a deeper slide.
- Ideal Entry Range: 156.90 to 161.94
- Exit Target (Target Price): 167.60 to 168.06
- Stop Loss protection: below 155.82
For non-traders: HSBC is sitting in a tight technical range, and the next move depends on whether support at 156.90 holds or gives way.
Summary Data HSBC
| Last price | 159.00 HKD |
| Change 1 day / 5 days / 1 month | 0.06% / -0.19% / -1.00% |
| Trend / MA-cross | downtrend / death |
| SMA20 / SMA50 | 161.94 / 162.23 |
| RSI (14) / Stochastic %K | 45.0 / 35.1 |
| Bollinger %B / ATR | 26% / 2.80 |
| Support / Resistance 20 days | 156.90 / 167.60 |
| Data as of | 29 September 2026 08:30 WIB |

