BP Stock Analysis: Drops 1.40%, Momentum Weakens
On September 30, 2026: price 550.70 GBp, trend sideways, RSI 56.1, support 539.70, resistance 580.30. technical analysis of bp stock. BP Stock Analysis — full…

BP plc is trading at a point where the broader trend still leans constructive, but the latest price action is showing hesitation. The shares closed at 550.70 GBp, down from 558.50 in the previous session, even though the stock remains above its longer moving average and within a wider up-and-down range that has defined the past few months.
Trend & Price Action
The chart shows a market that is not trending cleanly in either direction. BP is below its SMA20 at 556.18, which matters because the 20-day average often acts like a short-term “line of control” for momentum traders. At the same time, the price is still above the SMA50 at 541.84, so the medium-term structure has not broken down. That combination usually signals a stock that is still in a broader recovery phase, but is struggling to sustain upward follow-through.
The trend is sideways, and the SMA20 slope of 1.63% over 5 days suggests the recent drift has been positive, just not strong enough to keep price above the short average. In plain terms, buyers have not lost the field, but they have also not seized it decisively. The stock is sitting at about 27% of the 20-hour range between 539.70 support and 580.30 resistance, which places it closer to the lower end of the band than the upper end.
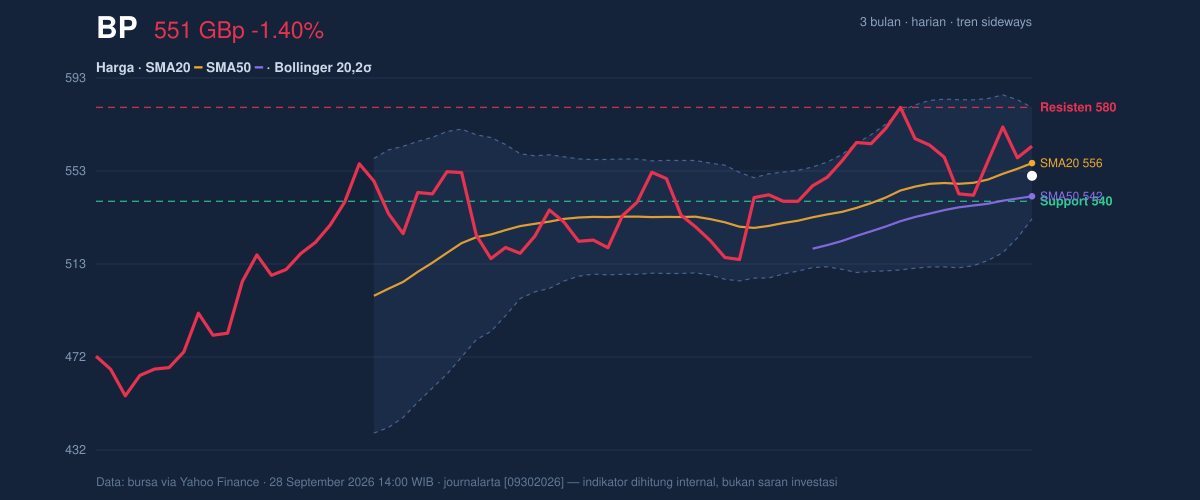
That positioning matters because the share price is still within the broader 3-month range of 450.60 to 582.60. It is not testing the lows, but neither is it pressing the highs. The market is waiting for a catalyst.
Oscillators & Momentum
The momentum picture is mixed, and that is where the story becomes more cautious. RSI at 56.1 is neutral, which means the stock is neither overbought nor oversold. That is usually a sign of balance, not urgency. Stochastic at %K 65.1 and %D 69.2 is also neutral, but it sits a little higher than RSI, implying the recent bounce has some life without being stretched.
The more important signal is from MACD. MACD at 7.104 is below its signal line at 7.921, and the histogram is -0.817. For readers less familiar with the indicator, that negative histogram means short-term momentum is softer than the longer trend, often a warning that a rally is losing pace before price fully reflects it. It does not confirm a major reversal on its own, but it does explain why the stock is struggling to hold above the short average.
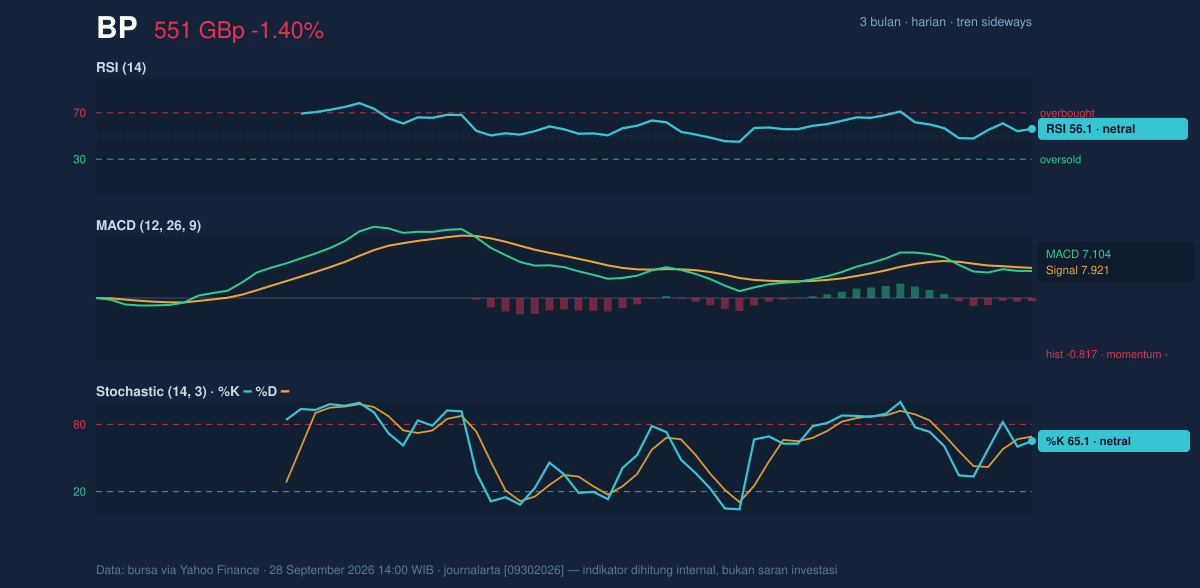
So the momentum set-up is not bearish enough to imply immediate breakdown, but it is weak enough to prevent a clean bullish read. The indicators are aligned around “pause,” not “push.”
Volatility & Volume
Volatility is moderate rather than explosive. ATR(14) at 15.24, equal to 2.8% of price, suggests BP can still move meaningfully in a session, but not in a disorderly way. The Bollinger Band width of 8.7% is normal, which points to an ordinary volatility regime rather than a squeeze that often precedes a sharp breakout. Price is sitting at %B 39%, meaning it is in the lower part of the Bollinger envelope but not near the lower band at 532.12. That usually indicates softness without panic.
Volume is the more striking clue. Last volume at 24,815,680 was well below the 20-hour average of 47,517,528, or about 0.5× normal activity, and OBV is falling. OBV, or on-balance volume, tracks whether trading flow is supporting the price trend. A declining OBV while price is only drifting sideways tells you participation is fading on the upside. In other words, the market is not showing strong conviction behind the latest moves.
That matters because breakouts tend to be more credible when they arrive with rising volume and improving OBV. Here, the opposite is true.
Key Levels & Scenarios
The nearest support is 539.70, and the nearest resistance is 580.30. Those levels frame the stock’s current battle. A move back above SMA20 at 556.18 would be a useful first sign that short-term pressure is easing, but the more meaningful test sits near the upper boundary of the range at 580.30 and the Bollinger top at 580.25. Those two levels are effectively the same ceiling.
If BP holds above 539.70 and reclaims 556.18, the chart would suggest the recent dip is only a pause within the broader range. If instead it loses 539.70, the next message from the chart would be that the stock is slipping out of its current holding pattern and back toward the lower half of the 3-month range.
Technical Verdict: HOLD (wait & see)
HOLD (wait & see)
- Why this verdict: price is below SMA20, which caps immediate momentum.
- Why this verdict: MACD is negative versus its signal line, showing fading short-term strength.
- Why this verdict: volume is only 0.5× average and OBV is down, so the market is not yet confirming a stronger move.
- Verdict invalidated if price breaks below 539.70, because that would weaken the current range structure.
- Ideal Entry Range: 539.70 to 556.18
- Exit Target: 580.25 to 580.30
- Stop Loss protection: 532.12, with 539.70 as the first line of defense
In plain English: the chart says BP is still in the game, but it needs stronger buying to prove the recent weakness is only temporary. The next scheduled test is whether price can reclaim 556.18 and then challenge 580.30.
Summary Data BP
| Last price | 550.70 GBp |
| Change 1 day / 5 days / 1 month | -1.40% / 1.44% / 7.04% |
| Trend / MA-cross | sideways / none |
| SMA20 / SMA50 | 556.18 / 541.84 |
| RSI (14) / Stochastic %K | 56.1 / 65.1 |
| Bollinger %B / ATR | 39% / 15.24 |
| Support / Resistance 20 days | 539.70 / 580.30 |
| Data as of | 28 September 2026 14:00 WIB |

