BP Stock Drops 3.74% Today, Momentum Gains
On September 22, 2026: price 542.90 GBp, trend sideways, RSI 56.1, support 514.50, resistance 580.30. technical analysis of bp stock. BP Stock Drops — full…

BP plc is trading in a narrow but telling range: the shares slipped to 542.90 GBp on the LSE, and the move leaves the stock below its short-term average even as longer-term support remains intact. That combination matters because it suggests the market is not in free fall, but it is still struggling to reclaim momentum after a weak few sessions.
Trend & Price Action
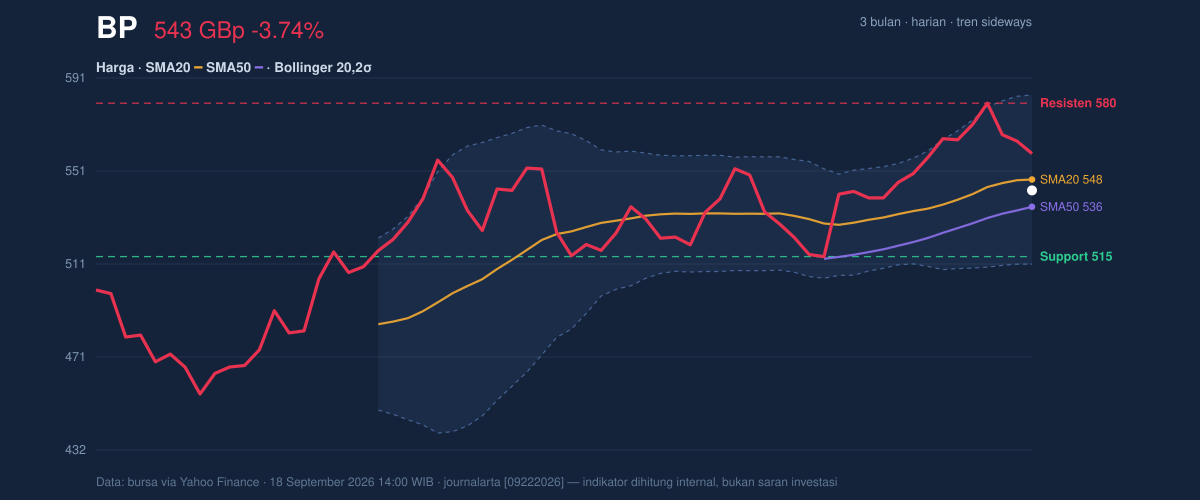
As shown in the chart, BP’s price is sitting below the SMA20 at 547.59 but above the SMA50 at 535.90. That positioning usually signals a market that is neither clearly trending up nor breaking down decisively. In plain language: the short-term tone has softened, yet the medium-term structure has not been damaged.
The broader pattern is described as sideways, and the SMA20 slope of 1.61% over 5 days shows the short average is still rising, albeit modestly. That is an important nuance. A rising SMA20 often tells traders that recent buying interest has not disappeared; however, the fact that price is below it means that interest has not been strong enough to hold above the short-term trend line.
The stock is also trading well within its recent band. It sits at roughly 43% of the 20-hour range, with 20-hour support at 514.50 and 20-hour resistance at 580.30. The 3-month range, from 450.60 to 582.60, shows BP is closer to the upper half of its longer recent range than the lower half, but still below the peak. That matters because it frames the current pullback as a pause inside a broader range rather than a full trend reversal.
Oscillators & Momentum
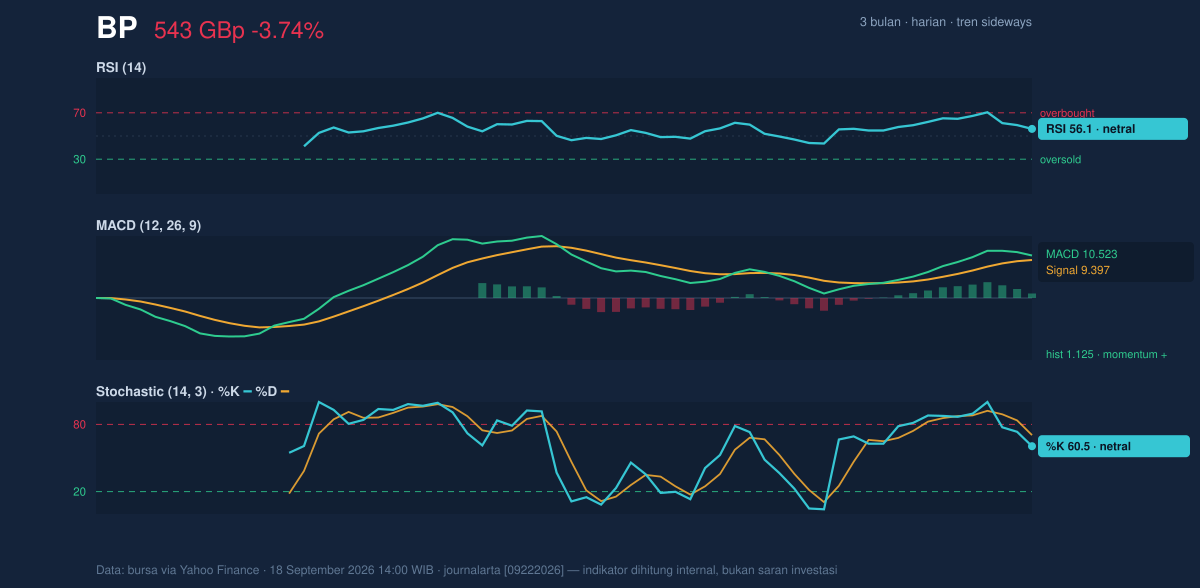
The momentum picture is mixed, and that is why the chart deserves a careful read. RSI(14) at 56.1 is neutral-to-firm, which means the shares are not overbought and still have room to extend if buyers reappear. The Stochastic %K at 60.5 and %D at 70.4 also sits in neutral territory, though the %K below %D hints that near-term momentum has cooled from a stronger position.
The clearest positive signal comes from MACD. MACD at 10.523 remains above the signal line at 9.397, and the histogram at 1.125 is still positive. In practical terms, that means the underlying trend impulse is still upward, even if price has slipped below the short moving average. This is the kind of setup that often appears when a stock is consolidating rather than rolling over hard.
The key point is that the oscillators are not flashing panic. They are pointing to moderation. That reduces the odds of a sharp one-way move unless price breaks one of the nearby boundaries.
Volatility & Volume
Volatility is present, but not extreme. ATR(14) at 16.91, equal to 3.1% of price, indicates a normal trading environment rather than a disorderly one. The Bollinger Band width of 13.3% is also described as normal, which suggests the market is not in a squeeze that typically precedes a breakout, nor in an expansion phase that would imply urgency.
The Bollinger position is important here. BP is trading with %B at 44%, meaning the price is below the middle band at 547.59 but still comfortably above the lower band at 511.32. In chart terms, that places the shares in the lower-middle part of the envelope. It is a sign of softness, but not of stress. If price begins to reclaim the middle band, the chart would look healthier; if it moves toward the lower band, the market would be telegraphing a deeper test of support.
Volume adds a constructive layer. Last volume was 65,910,449, or about 1.4× normal versus the 20-hour average of 47,160,465. That means the latest move lower was not happening on thin participation. Importantly, OBV is rising, which suggests volume flow has not turned decisively against the stock. Rising on-balance volume often implies accumulation is still present beneath the surface, even when price is temporarily soft.
Key Levels & Scenarios
The immediate map is straightforward. 547.59 is the first level to watch because it is both the SMA20 and the Bollinger middle band. A clean recovery above that zone would indicate the short-term drift has stabilized. Above that, 580.30 is the near resistance that has to be cleared before the chart can challenge the 582.60 3-month high.
On the downside, 535.90 is the next important reference because it is the SMA50. A break below that would weaken the medium-term structure and raise the probability of a move toward 514.50, the 20-hour support, and then the Bollinger lower band at 511.32. That lower band is especially important because it marks the area where the market would begin to look more defensive.
The signal set is therefore balanced: price is below the short average, above the medium average, momentum is neutral-to-positive, and volume is supportive. That is a classic consolidation profile rather than a decisive trend break.
Technical Verdict: HOLD (wait & see)
HOLD (wait & see)
- Price is below the SMA20 at 547.59, which caps the short-term trend.
- MACD remains positive with the histogram above zero, so downside momentum is not yet dominant.
- OBV is rising and volume is running at 1.4× normal, which argues that the latest dip still has active participation rather than abandonment.
Verdict invalidated if price breaks 514.50.
- Ideal entry range: 535.90 to 547.59
- Exit target: 580.30 to 582.60
- Stop loss protection: below 514.50
In plain English: the chart is not broken, but it has not yet proved it can regain its short-term trend.
Summary Data BP
| Last price | 542.90 GBp |
| Change 1 day / 5 days / 1 month | -3.74% / -3.84% / -1.68% |
| Trend / MA-cross | sideways / none |
| SMA20 / SMA50 | 547.59 / 535.90 |
| RSI (14) / Stochastic %K | 56.1 / 60.5 |
| Bollinger %B / ATR | 44% / 16.91 |
| Support / Resistance 20 days | 514.50 / 580.30 |
| Data as of | 18 September 2026 14:00 WIB |



