HSBC Stock Analysis: Drops 0.06%, Testing Support Level
On September 22, 2026: price 161.50 HKD, trend sideways, RSI 48.3, support 159.60, resistance 167.60. technical analysis of hsbc stock.

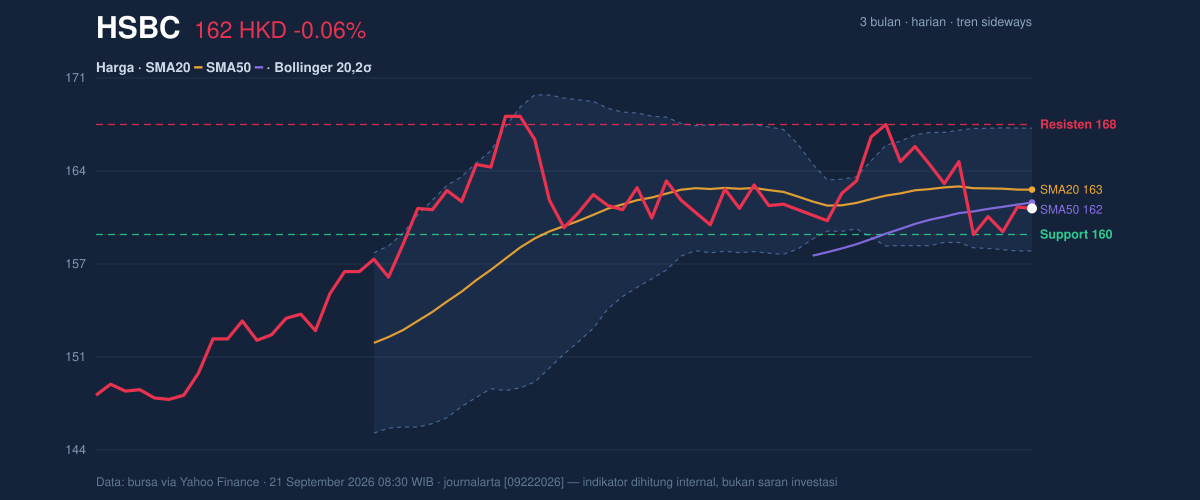
HSBC Holdings’ Hong Kong-listed shares ended at HKD 161.50, slipping 0.06% on the day and leaving the stock almost unchanged over the past month, but the technical picture is less about the size of the move than what it says about conviction: price is sitting below the 20-day moving average at 162.87, just under the 50-day average at 161.93, with trading still boxed inside a narrowing range. As shown in the chart, that combination usually signals a market waiting for a catalyst rather than one already in motion.
Trend & Price Action
The share price is in a sideways trend, and the slope of the SMA20 at -0.14% over five days shows the short-term drift is still slightly lower. That matters because a sideways label can sound neutral, but here it comes with a subtle bearish tilt: the stock is trading below the SMA20, which often means recent buyers have not yet regained control of the tape. At the same time, the price remains only marginally under the SMA50 at 161.93, so this is not a clean downtrend. It is more of a balancing act, with the market trying to decide whether to reclaim the mid-range or roll back toward support.
The broader range also frames the setup. HSBC is trading well below the 3-month high of 169.70 but above the 3-month low of 145.40, which places it in the middle third of the recent band rather than at an extreme. The latest close sits near the lower half of the 20-day range, at 24% of the range, which tells you the stock is not under immediate breakdown pressure, but neither is it showing enough strength to push toward the top of the channel.
Short version: the chart is waiting for direction.
Oscillators & Momentum
The momentum signals are mixed, and that mix matters more than any single reading. The RSI at 48.3 is neutral, which means HSBC is neither overstretched on the upside nor washed out on the downside. That usually points to a market lacking urgency. The Stochastic %K at 32.6 and %D at 27.0 also sit in neutral territory, but they are closer to the lower end of the band, hinting that recent price action has been soft without reaching a true oversold condition. In plain language: sellers have had the upper hand, but not decisively enough to force capitulation.
The more important signal comes from MACD. With MACD at 0.006 versus a signal line at 0.532, and a histogram of -0.527, momentum is negative. That gap says the shorter-term trend is running behind the smoother trend line, a classic sign that upside energy has faded. It does not automatically mean a sharp decline is coming, but it does mean any rebound has to prove itself against a still-hostile momentum backdrop.
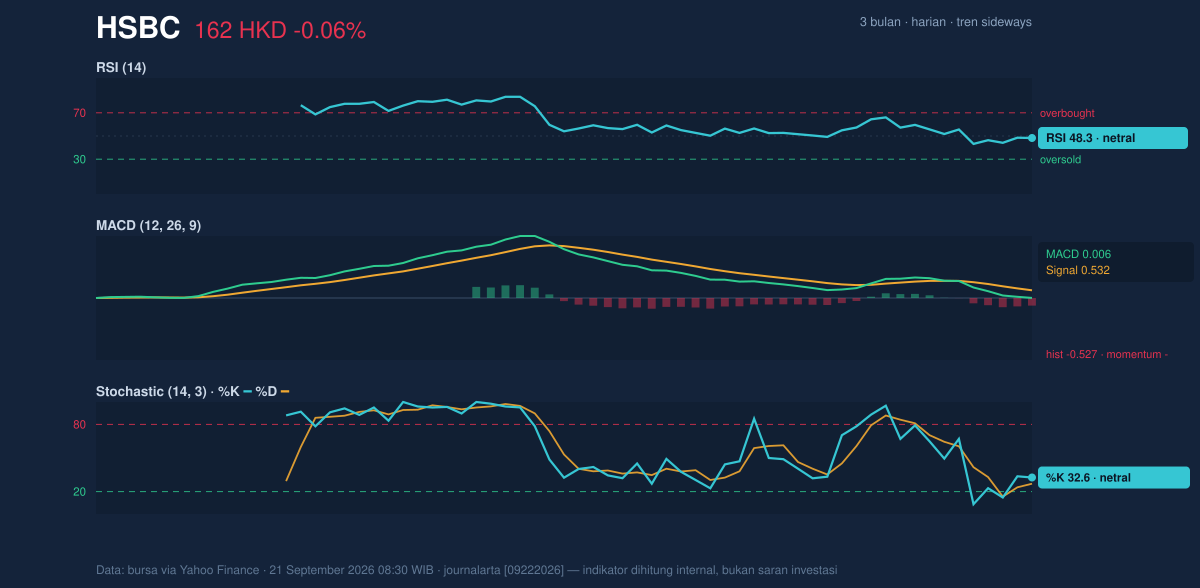
So the oscillators are not oversold enough to promise an easy bounce, and not strong enough to confirm a breakout.
Volatility & Volume
Bollinger Bands are telling the more interesting story. The 20-day Bollinger band width is 5.5%, which is relatively tight and indicates a squeeze. A squeeze often precedes a larger move because the market has compressed into a narrower trading lane; when that happens, even modest news or order flow can trigger a sharper expansion. HSBC’s %B at 35% shows price is sitting in the lower portion of the band, closer to the lower half than the upper edge. That is consistent with a cautious tone, but not a panic tone.
Volatility is present, but not extreme. The ATR(14) at 2.75, equal to 1.7% of price, suggests typical daily movement is moderate. That matters because a squeeze with moderate ATR can still produce a meaningful directional break, but it also means false starts are possible if volume does not confirm.
And volume is the weak link right now. The latest turnover of 5,788,715 is only 0.6x the 20-day average of 10,013,611, and OBV is falling. OBV, or on-balance volume, tracks whether trading activity is flowing into the stock or out of it. A falling OBV alongside light volume says rallies are not yet being backed by broad participation. That is a warning sign for bulls: price can drift higher on thin trade, but it is harder to sustain without stronger buying pressure.
In other words, the market is compressed, but not yet committed.
Key Levels & Scenarios
The nearest technical floor is the 20-day support at 159.60. If that level holds, HSBC can continue to trade inside the current range and potentially work back toward the mid-band and moving averages. If it fails, the chart opens the door to a deeper test of the lower Bollinger area at 158.39, which would likely intensify the negative momentum already visible in MACD and OBV.
On the upside, the first ceiling is the 20-day resistance at 167.60, just below the 3-month high of 169.70. A move through that zone would be important because it would not only clear recent resistance, but also push price toward the upper Bollinger band at 167.34 and signal that the squeeze is resolving higher. Until then, the stock remains trapped between support and resistance, with the moving averages acting as a pivot zone rather than a trend launchpad.
Technical Verdict: HOLD (wait & see)
HOLD (wait & see)
- RSI at 48.3 and Stochastic at 32.6/27.0 are neutral, so momentum is not strong enough to confirm a directional breakout.
- MACD is negative and OBV is falling, which argues against treating the current range as a clean recovery phase.
- The Bollinger squeeze and price sitting near the lower half of the range suggest a move may be coming, but the direction is not yet confirmed.
- Verdict invalidated if price breaks below 159.60 on a sustained basis, or if it reclaims and holds above 167.60 with stronger participation.
- Ideal entry range: 159.60 to 161.93
- Exit target: 167.34 to 167.60
- Stop loss protection: below 158.39
For non-traders, this means HSBC’s chart is waiting for proof before it shows its next clear direction.
The latest close was HKD 161.50 against a previous close of HKD 161.60.
Summary Data HSBC
| Last price | 161.50 HKD |
| Change 1 day / 5 days / 1 month | -0.06% / -2.06% / 0.00% |
| Trend / MA-cross | sideways / none |
| SMA20 / SMA50 | 162.87 / 161.93 |
| RSI (14) / Stochastic %K | 48.3 / 32.6 |
| Bollinger %B / ATR | 35% / 2.75 |
| Support / Resistance 20 days | 159.60 / 167.60 |
| Data as of | 21 September 2026 08:30 WIB |



